The traders trading stocks or other financial instruments like to use candlestick charts as they evidently display how the price behaved during the certain period.
The candle consists of so-called “body” of a candle - the range between the opening and closing prices, and “shadows” which represent Highs and Lows of this period. The body of a candle can be created after its opening on Low and closings on High. In other cases when there is high volatility, the body of a candle can be created by quite strong movements of the price in a certain range.
Candles can serve as a key to the understanding of not only the movements of the price, but also market biases in relation to the specific stock or an index. For example, it is possible to speak about bullish moods if the candle is created by the stock after opening goes down, tests, support level, jumps aside from it and is closed on High.
Many graphical platforms are capable of distinguishing candles and to scan tools regarding search of candidates for trade. But it is impossible to rely only on computer technologies, it is desirable that the trader also knows how various candlestick patterns look like.
Let's consider four most widespread candlestick patterns and we will find confirmation of their importance on real charts.
Bullish Engulfing Candle
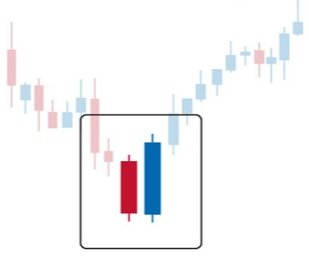 The pattern “bullish engulfing candle” is created when movement of the instrument price covers High and Low of the previous day. Engulf it. Usually, such pattern says to the trader that the price after down movement has found support or a large volume of purchases, and then has made movement up, having punched High of the previous day. Often, such candle can confirm the stability of the ascending trend or speak about a change of the going-down trend.
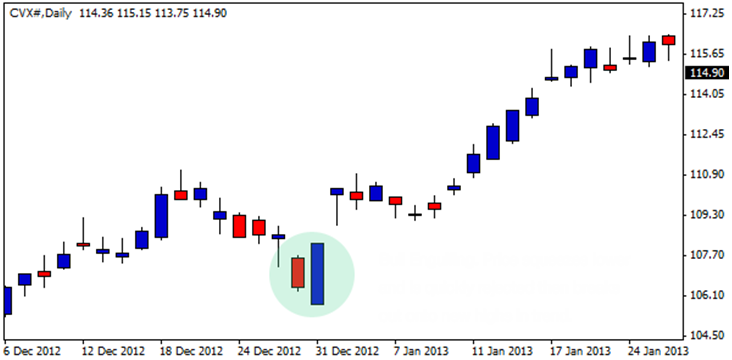
At the end of September 2012, the stock price of Chevron (CVX) has made kickback during the created trend. After testing lower levels, the price sharply returned up, at the same time the pattern of bullish engulfing was created. It was the sign of the new beginning of the ascending trend after the formation of the raising Low. In the first months of 2013, the price continued the up movement.
Bearish Engulfing Candle
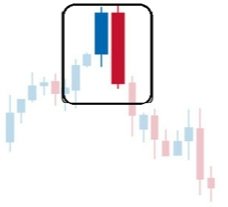 The pattern “bearish engulfing candle” is the opposite to the considered bullish engulfing. At the same time the price tests level over High of the previous day, and then, having found a large volume of sales there, sharply goes down, punching Low of the previous day. Such formation can serve as confirmation of the steady fall of the price or a sign of the trend change.
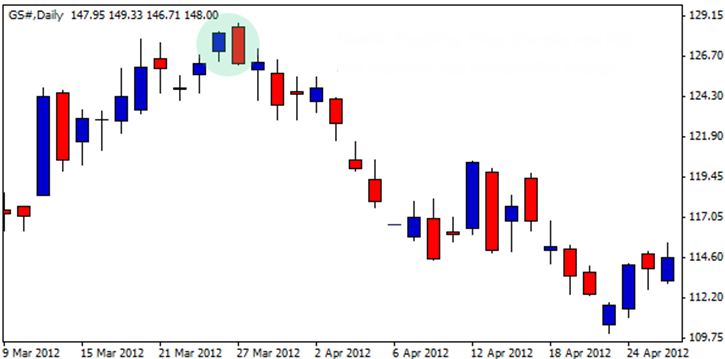
The bearish engulfing candle can arise at the top or during the existing trend, and speaks about down movement continuation. On the chart Goldman Sachs (GS) the going-down trend has started in March 2012 after forming at the top of an ideal bearish engulfing candle. The price has tried to come to new High but has been sharply rejected then fell within three months.
Reversal Candlestick Pattern “Hammer”
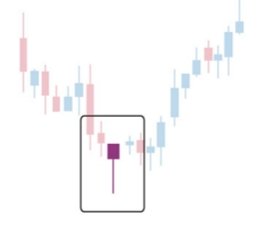 The pattern “hammer” can be created when the level of support or resistance are sharply rejected by participants of the market. In the stated below example, the price descended, but has found support or amount of purchases there. At this point control over the price has passed to bulls, therefore, the candle was closed in the region of the level of its opening.
Next day the strong bull candle was created which demonstrates that momentum remains. Traders and investors have considered this signal valuable and have begun to take the share that has led to the growth of the price. Such patterns can arise in both directions, creating candles in the form of a hammer.
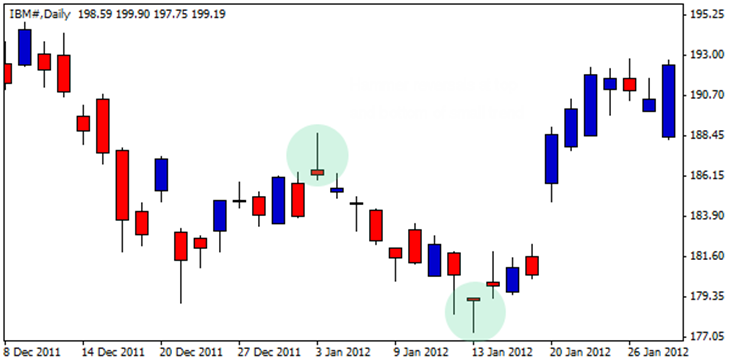
At the beginning of 2012, the stock price of the International Business Machines company (IBM) was in fragmentary range movement. Despite the availability of the general ascending trend, price fluctuations at the end of 2011 were not quite clear for traders. At the end of this fragmentary trend, there was a kickback at which from above and from below there was turning hammer models. After a turn at the bottom, the IBM stock has moved up to an aggressive movement which continued for months.
Doji Candlesticks
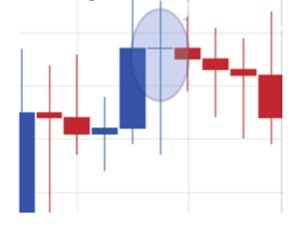 Doji are understood as a candlestick pattern which speaks about the failure to decide of tool movement. As a rule, these patterns are created in zones where there is a fight of bulls and bears for the further direction of price movement.
Doji candlestick is characterized by the very small body, that is opening and closing prices are very close. At the same time, it can have long shadows which say that levels from above and from below have been tested, but are not accepted. This model demonstrates to uncertainty and failure to decide about a movement, and that bulls and bears fight for control over the price. Often, after hitting of this candle there is a steady movement up or down.
Though the candle Doji cannot be considered as a good entrance to the transaction (because, according to its nature, probity can occur in any of the directions), it can speak about a change of moods in the market.
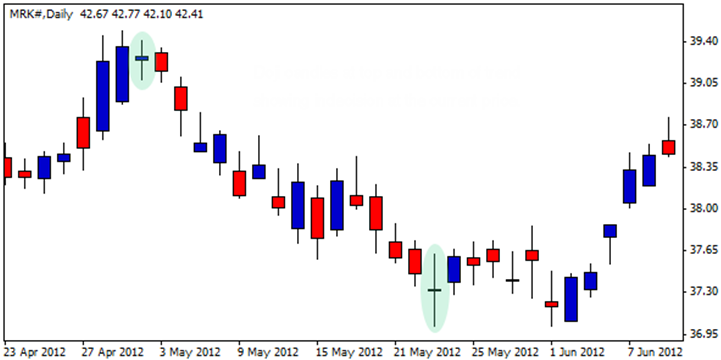
In the stated below example the stock Merck (MRK) came to new High, but the candle Doji was created next day. Who will win this fight - bulls or bears? As we see, bears have won, and after the first against Doji, allocated on the chart, has followed two very strong down days which have given rise to a new trend.
The second Doji that is marked out on the chart shows that moods can change. This Doji was created on Low after the game was entered by bulls who have seen the value of this share. As a result, within the next week, the support zone was created. After the price has punched a candle Doji up, in the stock the strong ascending trend which proceeded three months has begun.
Four considered candle patterns, in the case of their correct recognition, can be very useful to traders and investors. They give a good idea of market moods. Finding such signals at the levels of support and resistance, it is possible to predict the change of the price movement direction and to get a trading advantage.