Rates as of 05:00 GMT
Market Recap
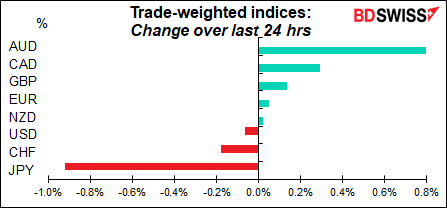
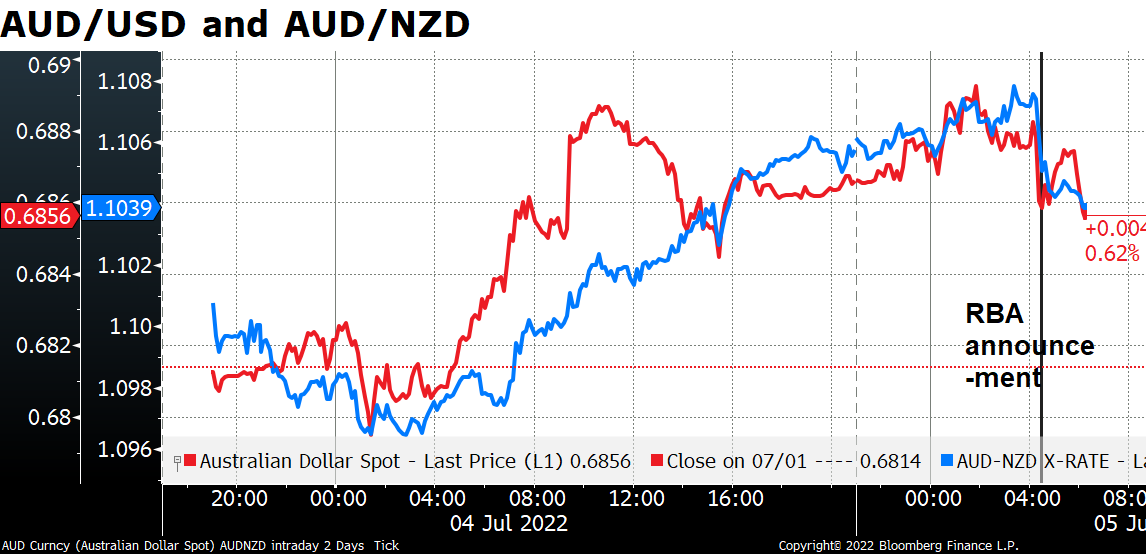
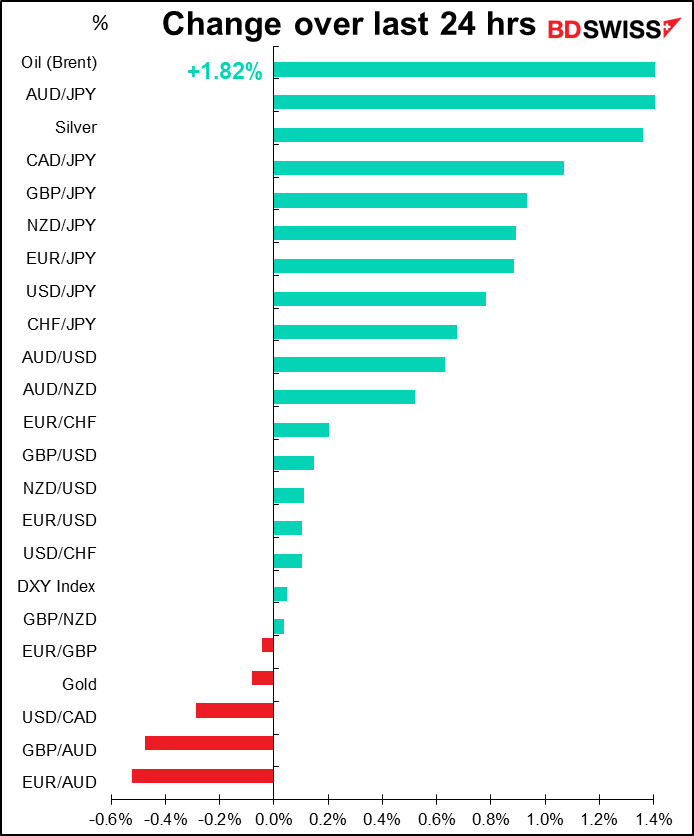
AUD was the best-performing currency ahead of this morning’s rate decision by the Reserve Bank of Australia (RBA). In the event they raised rates by 50 bps as most forecasters had predicted (25 out of 26 polled on Bloomberg). The currency fell on the news – a typical “buy the rumor, sell the fact” response. It tried to recover but at the moment is struggling. The RBA made no significant change to its forward guidance. The Board did say that “A full set of updated forecasts will be published next month following the release of the June quarter CPI,” indicating that they could hike faster – or slower, for that matter – depending on the message from the Q2 CPI, but there was nothing to suggest specifically that they might speed up the process.
I read some worrisome news for AUD on Twitter: Shanghai Macro Strategist said
The chairman of a leading steel firm said that the entire industry has reported loss and it is unclear when the loss may end. China’s property and infrastructure construction has been largely completed, while households have no money to buy properties, cars, and home appliances. More importantly, he said the ongoing infrastructure push is unlikely to materialize as there is simply a lack of funds. Local governments’ debt is already too high to further add leverage. This is in line with our view given Beijing’s unwillingness to remove constraints on LGFVs (local government financing vehicles).
This is very worrisome for AUD as iron ore & coal – the necessary ingredients for making steel – account for 45% of Australia’s exports. Of course not all the coal goes to steel-making or even to China for that matter (demand for coal for generating electricity has increased as oil prices rose) but still… This is one reason why I prefer NZD during an economic downturn – people will still have to eat (even if they don’t splurge on kiwis). See below for further analysis of this question.
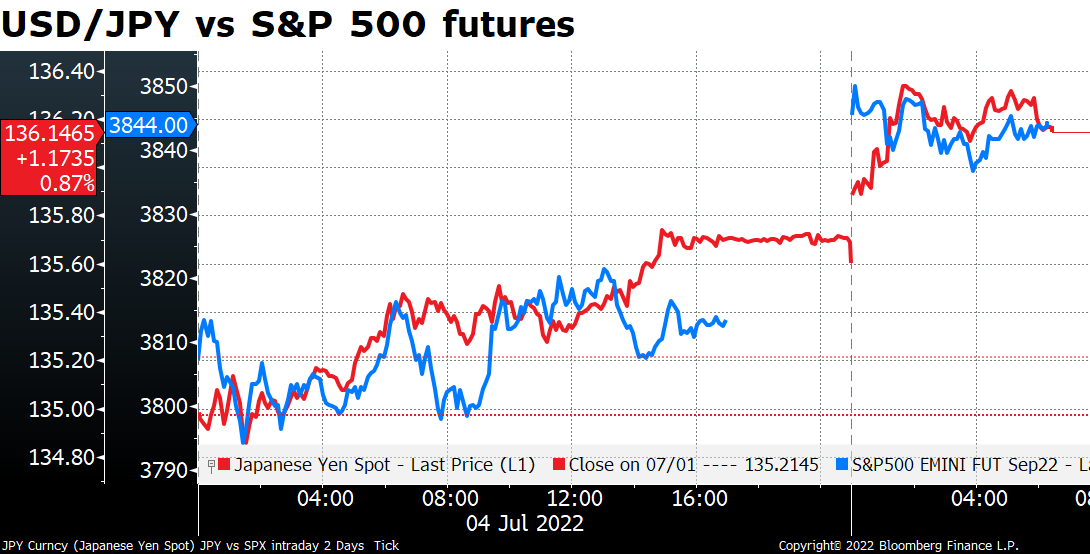
Meanwhile, JPY was the worst-performing currency – nothing new there! It’s back in the 136 range – still below the 137.00 that it hit on June 29th but getting there. There was a general “risk-on” mood in the market thanks to the news that the Biden administration may scrap Trump-era tariffs on some Chinese consumer goods in order to bring down inflation. US Treasury Secretary Yellen and Chinese Vice Premier Liu held a video talk to discuss the issue. The S&P 500 is indicated up 0.4% (the market was closed yesterday due to the Independence Day holiday, although the futures still traded.)
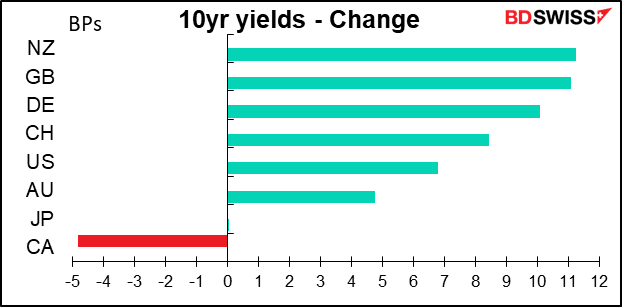
With the mood changing to “risk-on,” bond yields generally rose. It’s noticeable that CAD was the second-best performing currency even though its bond yields were the only major market to see lower yields. The rise in oil prices was probably behind that.
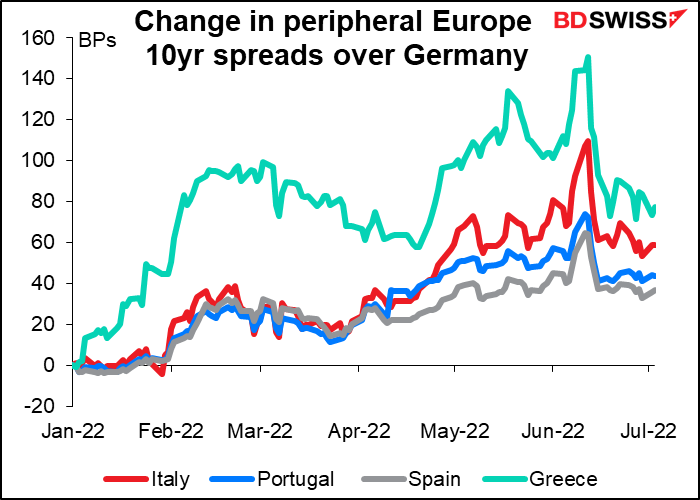
Peripheral Eurozone bond spreads widened slightly after Bundesbank president Nagel said that it was “virtually impossible to establish for sure whether or not a widened spread is fundamentally justified.” This of course calls into question the European Central Bank (ECB)’s proposed new anti-fragmentation instrument for the Eurozone, because if you can’t tell whether spread widening is justified you’ll have a hard time justifying the effort to prevent it from widening. Nevertheless, Nagel didn’t rule out an anti-fragmentation instrument but said that this “can be justified only in exceptional circumstances and under narrowly-defined conditions.” Nagel’s comments were quickly followed by ECB vice-president Luis de Guindos, who said it was critical to prevent financial fragmentation if the ECB were to raise interest rates – so you can see the disagreement within the ECB Governing Council right there.
The fear of fragmentation – basically, the concern that bond markets of financially troubled Eurozone countries might blow up as the ECB hikes rates – could be a drag on the euro until they finally decide what to do about this proposed “anti-fragmentation” tool.
By the way I didn’t have this on the calendar for yesterday as it’s not normally market-affecting but Germany in May recorded its first monthly trade deficit since 1991.
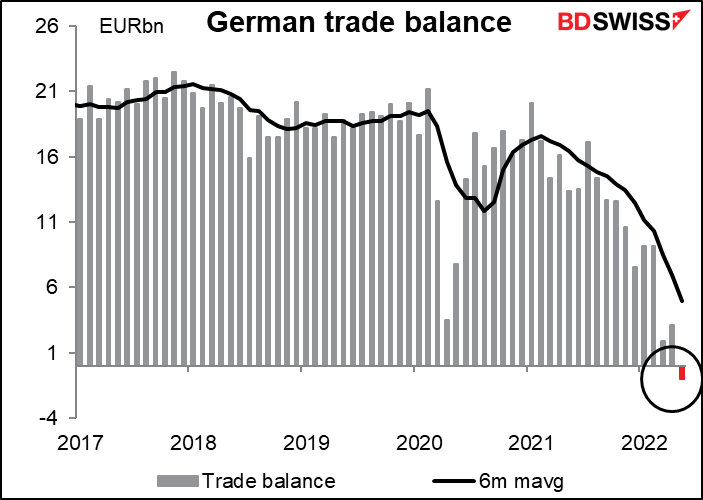
Look for this trade deficit to widen further as energy prices continue to rise. European natural gas futures rose by another 10% yesterday – they’ve more than doubled since their recent lows in early June. To make matters worse, Norwegian gas workers are planning to go on strike! The need to pay for higher energy costs could be a continued drag on EUR in coming months. This would dampen the economic activity (money spent on energy isn’t spent on other things) and restrain the ECB’s ability to hike rates to control inflation. It would therefore be negative for EUR.
A word about AUD/NZD and commodity prices
Yesterday I speculated that one of the reasons why NZD was outperforming AUD may be because in a recession prices of agricultural commodities are likely to hold up better than prices of industrial commodities. This got me wondering: does AUD/NZD really follow this trend? I looked at it using the Reserve Bank of Australia’s Index of Commodity Prices, an index of the price of Australian commodity exports, and the ANZ Bank New Zealand Commodity World Price index, a similar index for NZ. Since commodity prices form most of the denominators of each country’s terms of trade and the numerators – their imports – are likely to be similar, this analysis seems reasonable.
The result I got was: sometimes it works, sometimes it doesn’t. The same could be said for almost all such “rules of thumb” in markets.
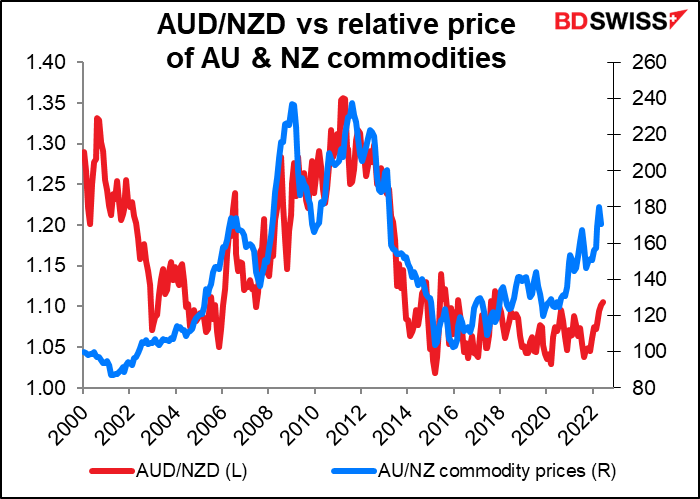
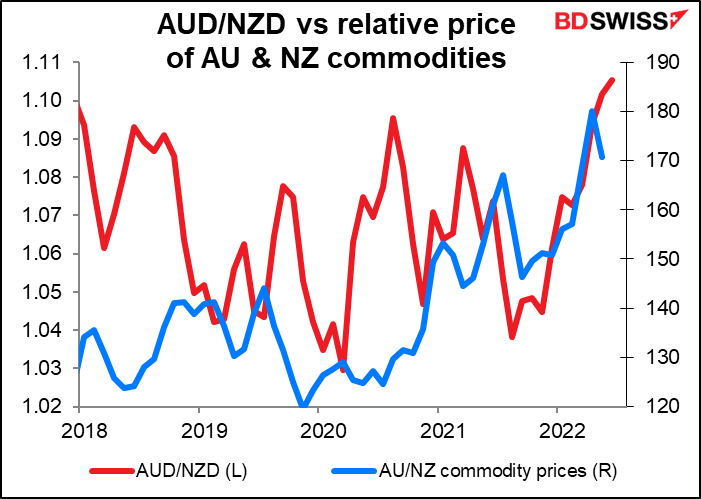
The last several years seem to be a time when it wasn’t working. However the two have shown a better correlation this year so it may be coming back into fashion. Or it may just be coincidence.
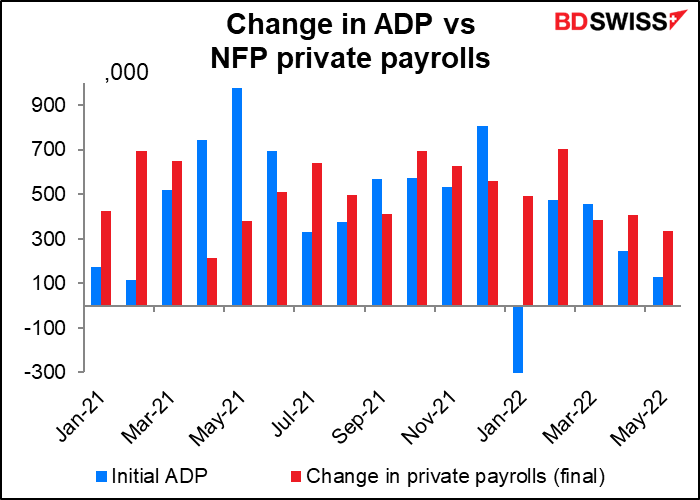
No ADP report until end-August at the earliest! ADP Research Institute (ADPRI) and the Stanford Digital Economy Lab announced that they are going to retool the (useless) ADP National Employment Report methodology “to provide a more robust, high-frequency view of the labor market.” As a result they will pause issuing the report. They hope to restart it on Aug. 31st this year.
I’ve often railed about the ADP report, which usually comes out two days before the US nonfarm payrolls (NFP) that it’s supposed to track but unfortunately has precious little information content useful for forecasting the NFP. (To be fair, the ADP report is trying to track the final estimate of private payrolls, which is not the same as the initial estimate of total payrolls that everyone gets excited about every month. But even there, its track record is less than perfect.)
Today’s market
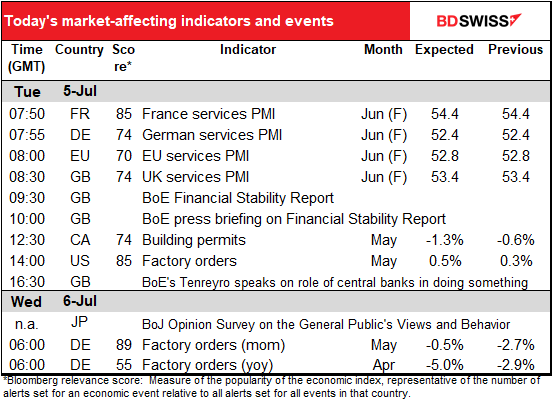
Note: The table above is updated before publication with the latest consensus forecasts. However, the text & charts are prepared ahead of time. Therefore there can be discrepancies between the forecasts given in the table above and in the text & charts.
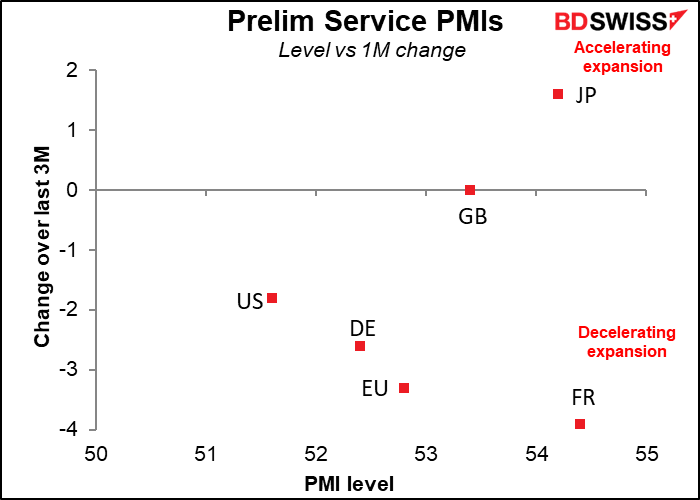
Not that much on the sked today. The final service-sector purchasing managers’ indices (PMIs) for those countries that have preliminary ones, and the one-and-onlies for those that don’t. The US version, which is normally followed by the closely watched Institute of Supply Management (ISM) version of this index, will come out tomorrow because of yesterday’s Independence Day holiday. The preliminary results showed service-sector activity slowing in all the reporting countries except Japan. If the rest of the world follows suit it shouldn’t be particularly good for risky assets or the commodity currencies.
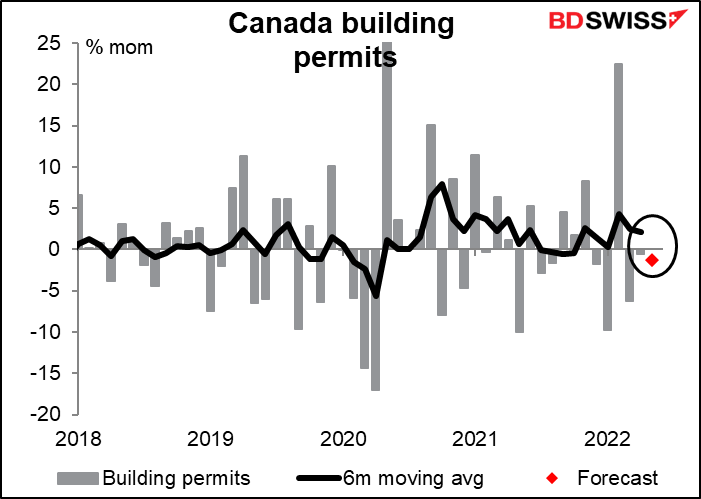
I have little to say about Canadian building permits except that housing markets around the world appear to be slowing as interest rates rise and stock markets crash.
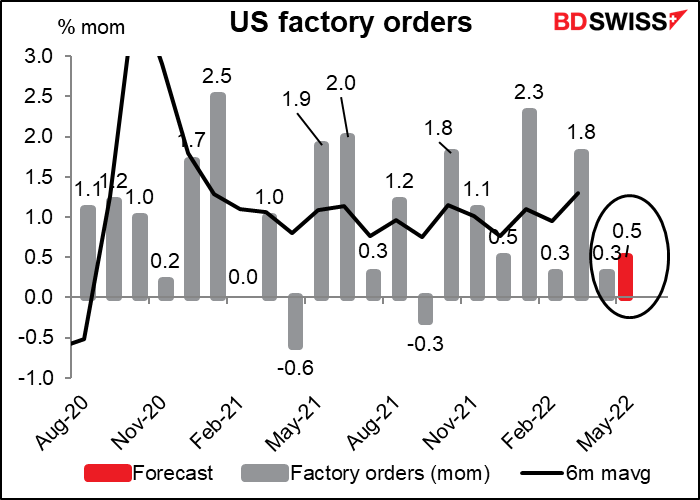
US factory orders are among my least favorite indicators as they are 92% a function of the US durable goods orders, which are already out so who cares about a derivative of them? Apparently some people do, judging from the relatively high Bloomberg relevance score (85), so I include a graph every month.
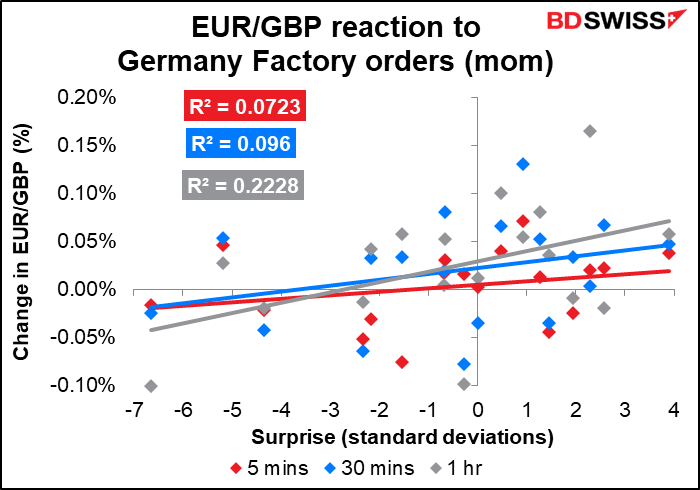
German factory orders, which come out early in the European day, are another matter entirely. They’re one of the key indicators for Germany.
I have to admit though that the FX market’s reaction to them is hardly overwhelming. Maybe that’s because of the time of day that they’re released?
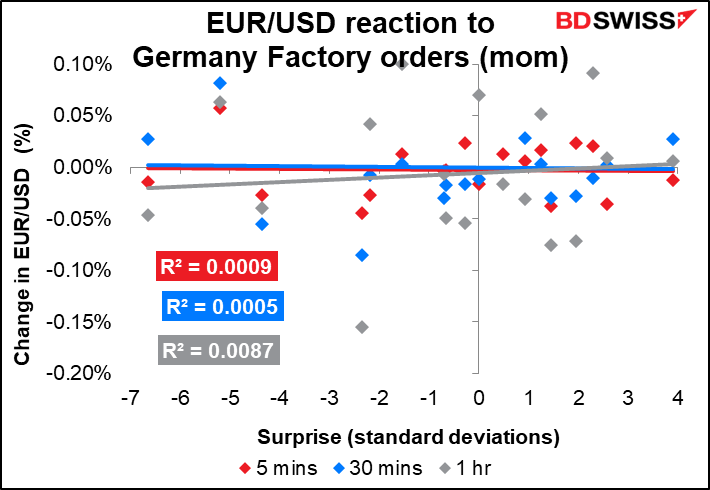
The reaction is a bit better in EUR/GBP.
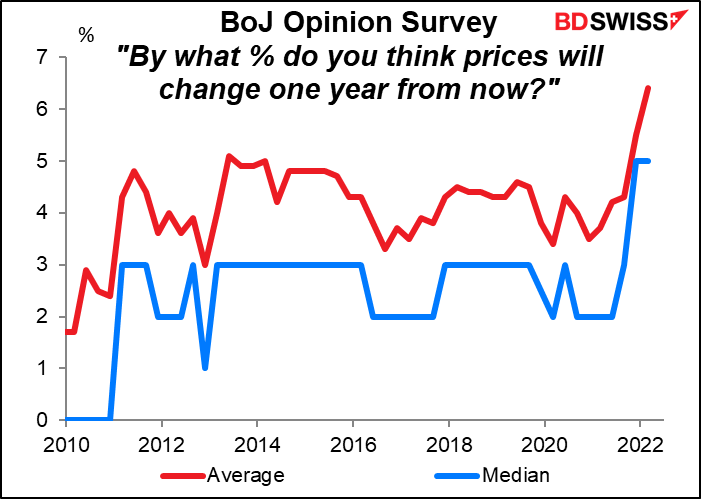
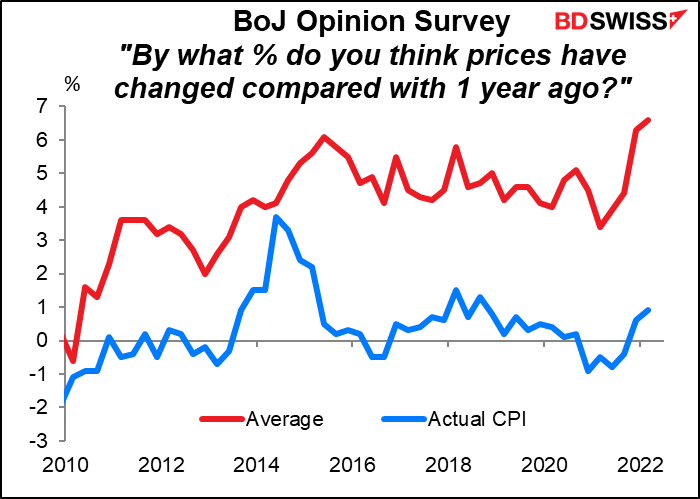
I’ve included something on the schedule that I’ve never discussed before, namely the Bank of Japan’s Opinion Survey on the General Public’s Views and Behavior. Normally this is not of much interest to the markets, but recently many people have been making a fuss about how households in Japan perceive inflation. A month ago BoJ Gov. Kuroda was forced to make a groveling apology for saying that households were becoming more accepting of price rises.
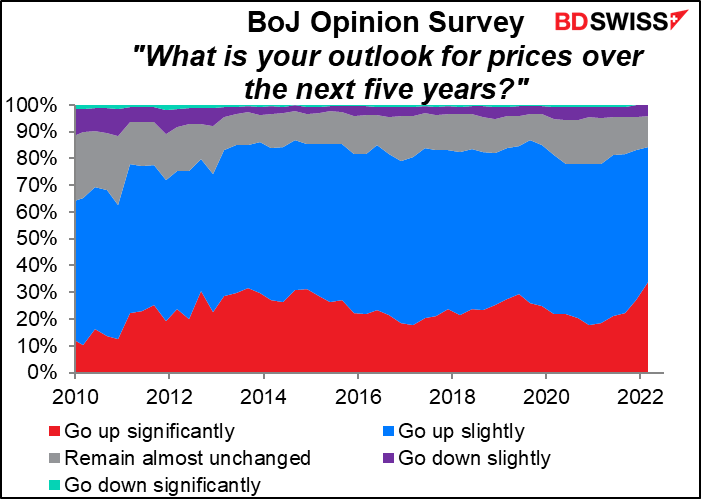
People will pay particular attention to the inflation expectations for the coming year and the next five years. The BoJ may start to get concerned about inflation expectations becoming unanchored.
Another important question is where they ask people how much they think prices have changed over the last year. For those who answer “up significantly” or “up slightly,” they ask their opinion of the price rises. Contrary to what Gov. Kuroda says, no one seems to like price rises very much – 82% of the people view price rises unfavorably and only 2.9% view them favorably. (The highest reading for this was in Q3 2008, when 93% viewed the price rises unfavorably even though the national CPI was rising only 2.1% yoy. The lowest reading was 77.0 in June 2019. Meanwhile, the highest that “rather favorable” ever got was 4.6% in Sep. 2018 when the national CPI was 1.3% yoy. Japanese people clearly do not like inflation no matter what economists say.)
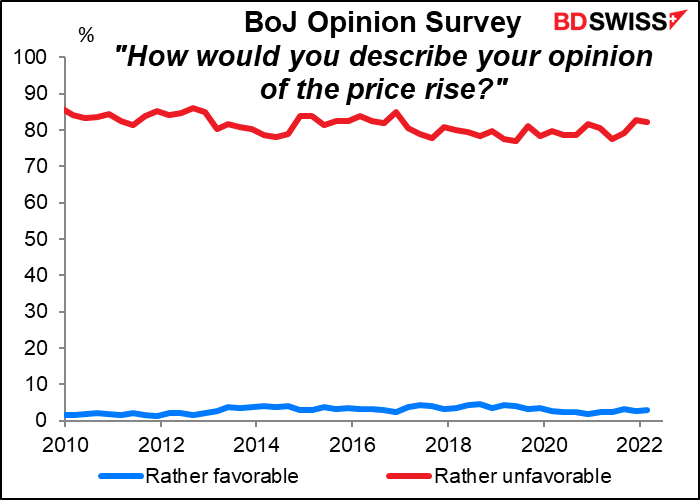
The survey shows that people aren’t very good at estimating inflation, or perhaps we should say that the official inflation rate is not very good at reflecting the change in prices that people perceive.
Source: BDSwiss