Rates as of 05:00 GMT
Market Recap
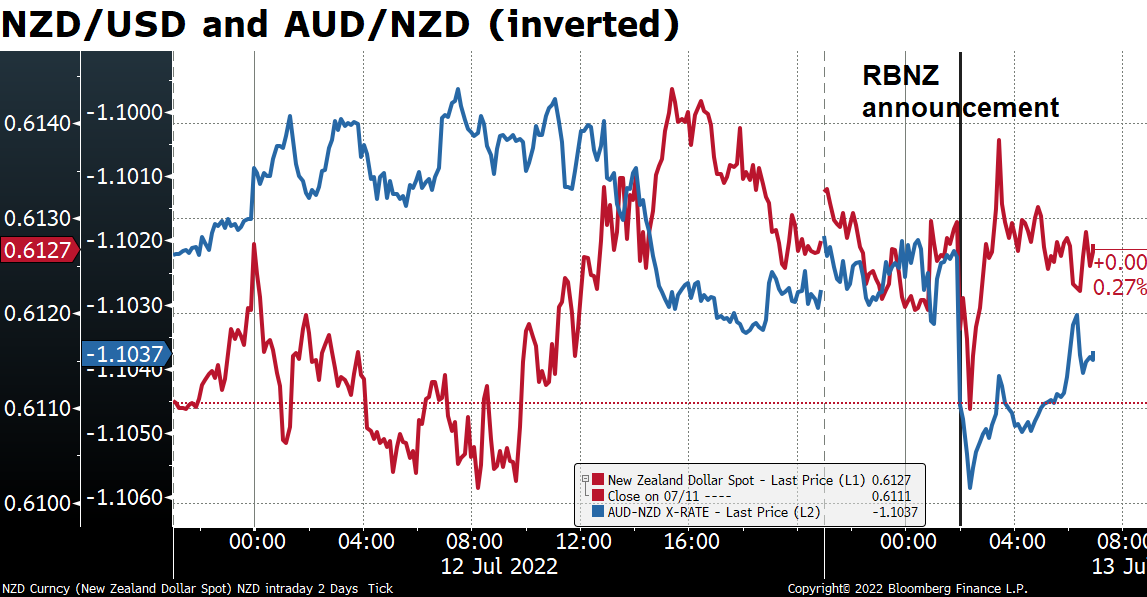
The RBNZ hiked rates 50 bps as expected and promised more. It kept a hawkish stance in the statement following the meeting, saying:
The Committee agreed it remains appropriate to continue to tighten monetary conditions at pace to maintain price stability and support maximum sustainable employment. The Committee is resolute in its commitment to ensure consumer price inflation returns to within the 1 to 3 percent target range.
Notice the terms “at pace” and “resolute.” This means further 50 bps hikes to come.
In the Summary Record of Meeting, it said
The Committee agreed to maintain its approach of briskly lifting the OCR until it is confident that monetary conditions are sufficient to constrain inflation expectations and bring consumer price inflation to within the target range.
Note the term “briskly.”
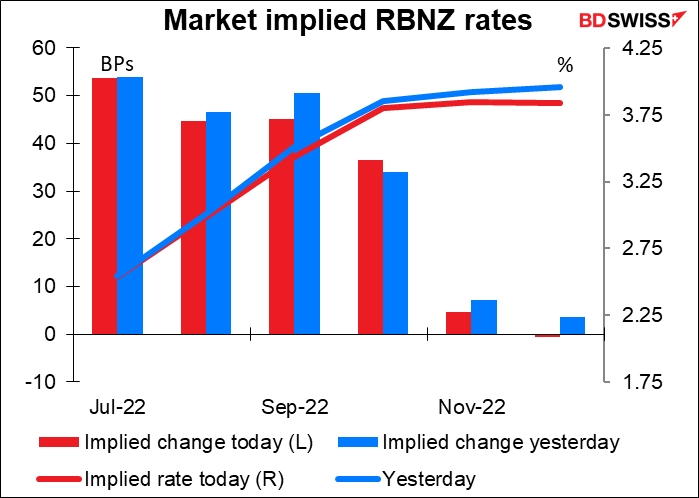
Nonetheless rate expectations fell slightly, perhaps because the statement included a reference to “emerging medium-term downside risks to economic activity.” They also removed the mention of hiking “at pace” from the forward guidance, the last paragraph in the statement, although as I noted they did mention it elsewhere.
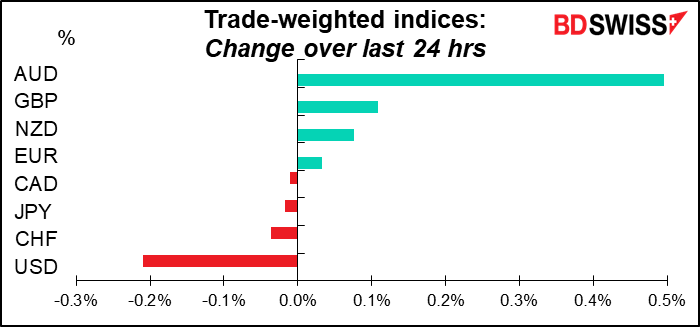
NZD initially fell after the meeting but quickly recovered.
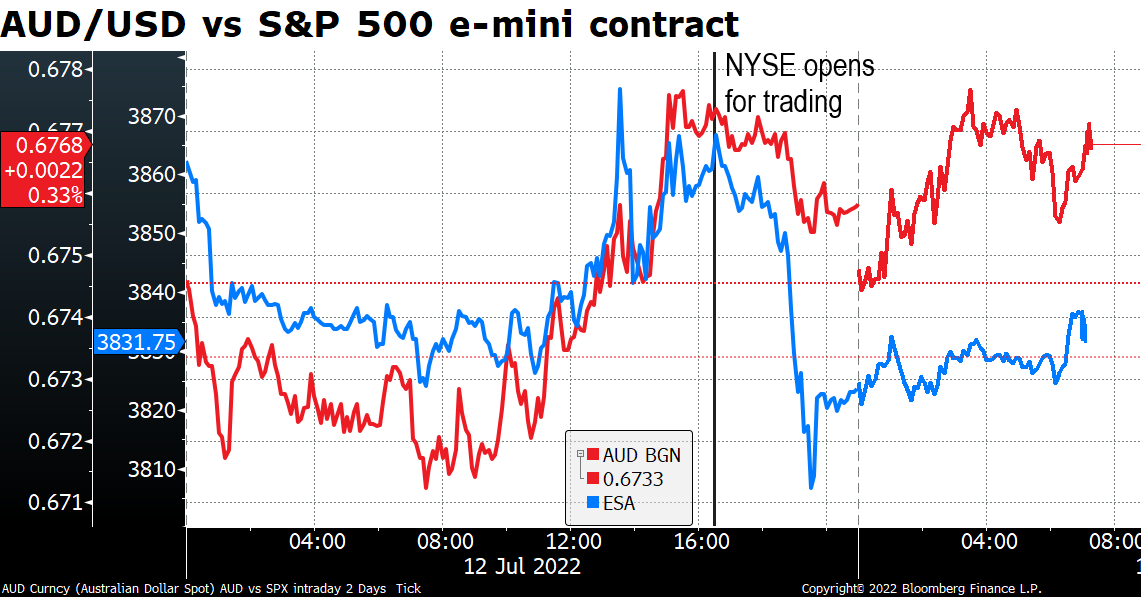
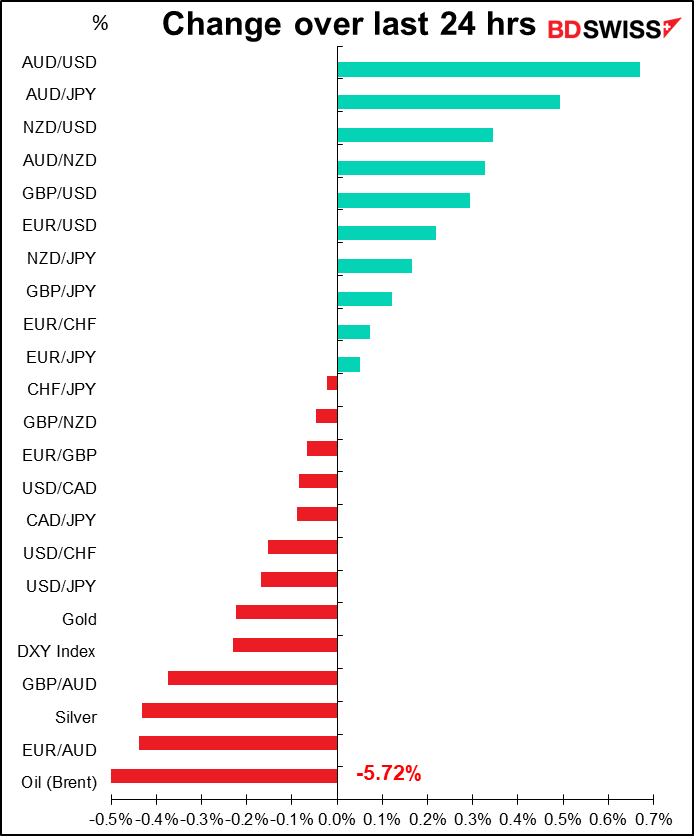
The big mystery of the day was why was AUD the best-performing currency? I’m quite puzzled. The mood was generally “risk-off” and commodities didn’t do so well – oil (Brent) was down 5.7% despite OPEC predicting demand outstripping supply by 1mn barrels a day (b/d) next year, while copper was off 3.6% and iron ore, a crucial export for Australia, -0.8%.
It seems that during the European day, risk sentiment was improving, as shown by the rising S&P 500 e-mini contract. AUD/USD followed that trend higher. But once the New York stock market opened for trading, stock sentiment turned sharply lower for reasons that remain a mystery. Some reports say it was algorithmic selling programs. There was a rumor that today’s US CPI report (see below) had been leaked and revealed to be 10%, but that was denied. In any event, AUD followed the market down somewhat but not as much as it had followed the market up.
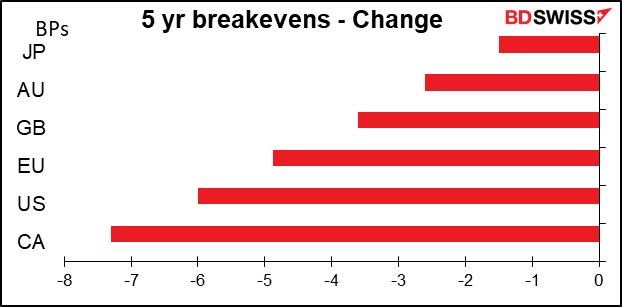
The fall in commodity prices has dampened inflation fears somewhat.
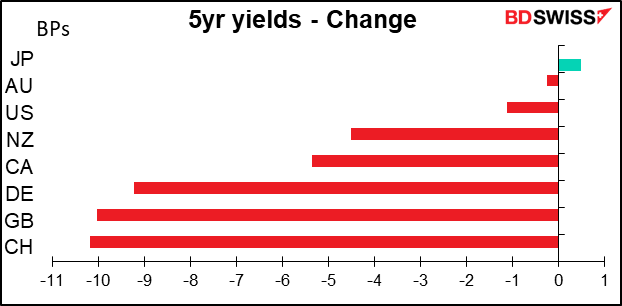
This generally led to lower bond yields.
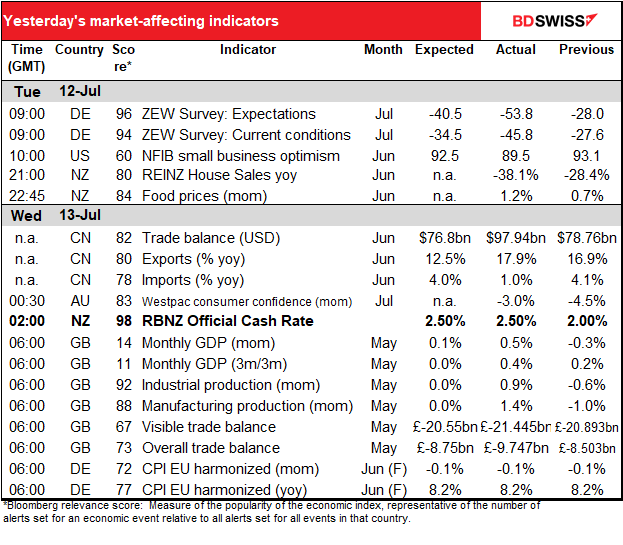
Britain’s May GDP beat expectations by a mile (see table above), which is likely to bolster the currency today. The Conservative Party will hold the first ballot for the party leadership election today. This will just be among the party’s Members of Parliament (MPs). Eight candidates will be on the ballot. The front-runner so far is former Chancellor of the Exchequer Rishi Sunak. Candidates who get the support of at least 30 MPs will then progress to tomorrow’s ballot. The two top vote-getters from that will then be elected by the party at large.
Today’s market
Note: The table above is updated before publication with the latest consensus forecasts. However, the text & charts are prepared ahead of time. Therefore there can be discrepancies between the forecasts given in the table above and in the text & charts.
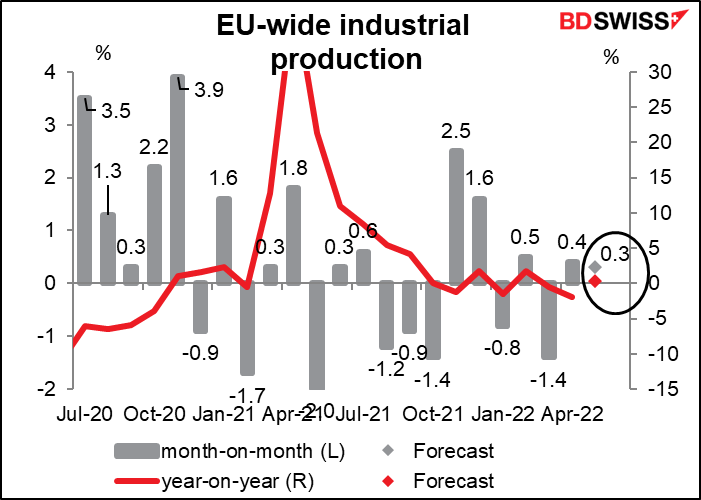
The day starts off with EU industrial production, not a major market-moving indicator most of the time but occasionally it does impact prices. I think though that the emphasis nowadays is on inflation, not production, although of course everyone is watching for signs of a recession too.
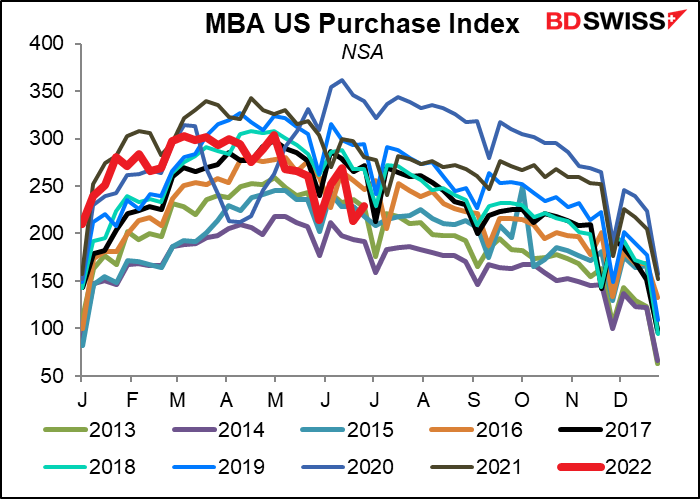
US mortgage applications started off the year strong but recently have slowed. They’re now in the bottom half of the range for the last 10 years. This is a sign that the Fed’s tightening – which has sent mortgage rates up to 5.75% from 3.3% at the beginning of the year – has started to slow the US economy.
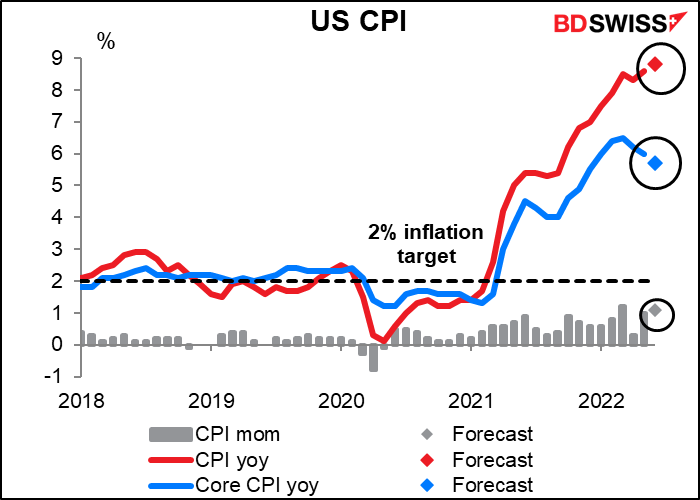
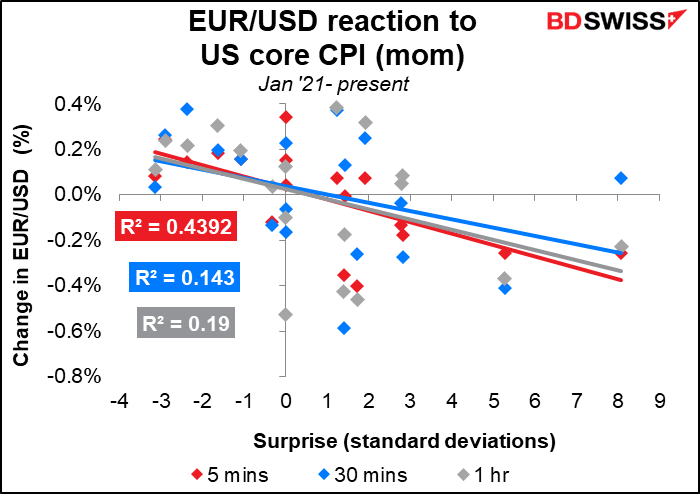
Now we get to the big indicator of the day: the US consumer price index (CPI), the most popular gauge of inflation. The headline figure is expected to show inflation rising still further, although the core measure – which excludes food and energy – is forecast to slow for the third month running. I don’t think that will convince anyone that inflation has turned, however. And with the Fed pledging to get inflation back to its 2% target no matter what, a further rise in inflation should cause US rate expectations to rise, boosting the dollar.
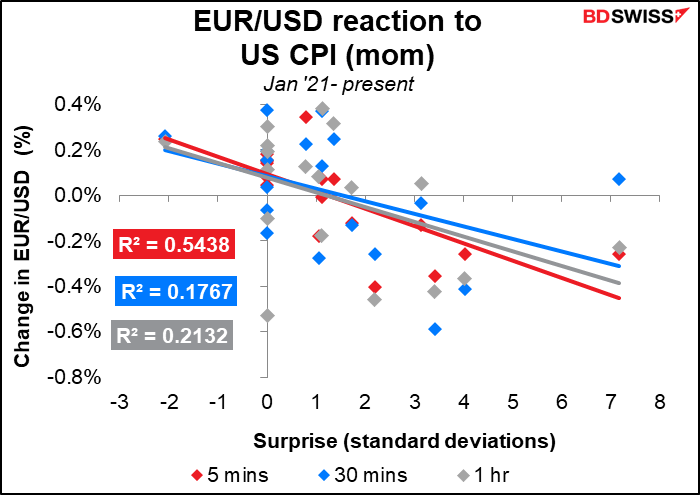
The focus on this indicator is on the month-on-month change in the headline figure.
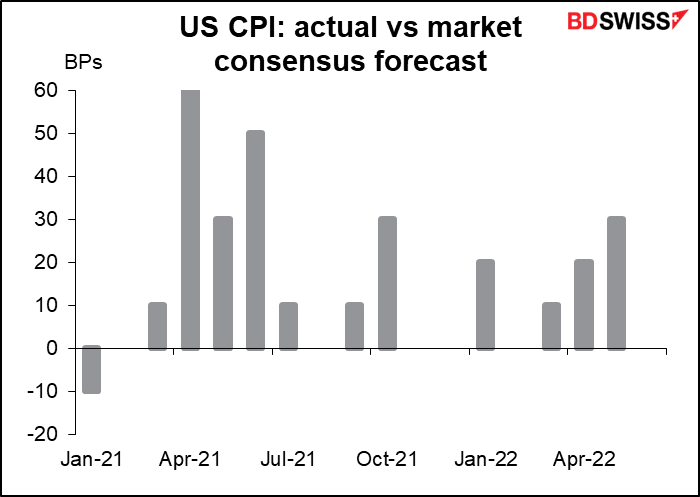
How well do the forecasters do on this indicator? Since the beginning of 2021, the CPI has beat the consensus forecast 10 times, equaled it 5 times, and missed only once. So the odds of missing the forecast are slim, although at some point the data will start to turn down just as economists give up and start pitching their forecasts a bit high and then we’ll get large misses.
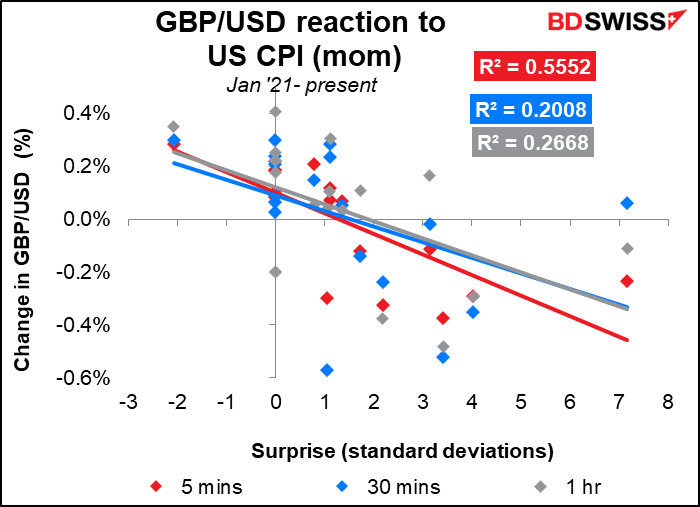
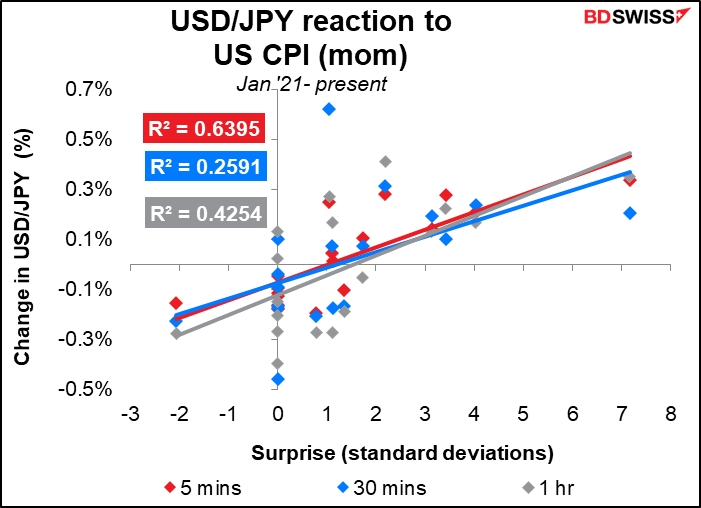
Market impact: The CPI has a strong and lasting impact on FX rates. Generally speaking, when it beats expectations the dollar strengthens, and vice-versa. Notice that when the actual equals the consensus – when the consensus forecast is correct and therefore the “surprise” is zero – the dollar tends to weaken.
The core data also affects the market, although not as much. Here the impact on the currency when the consensus forecast correctly predicts the actual figure is less pronounced, perhaps because people aren’t paying as much attention to the core figure.
The impact of the beat or miss on the year-on-year rates is of course similar, since they are both derived from the same number (the index for this month).
There’s something on the schedule I don’t remember seeing before – Richard Huges, the head of the UK Office for Budget Responsibility, testifies to the Treasury Committee in Parliament about the Fiscal Risks Report. My guess is that if the release of the document didn’t have any impact, testimony about it won’t either, but you never know.
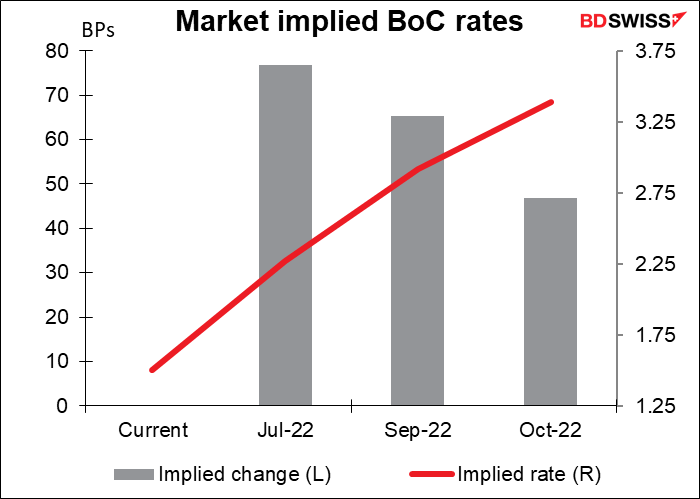
Then the other big event for the day, at least for those who trade CAD: the Bank of Canada meeting. As usual I ran through this in some detail in my Weekly Outlook, so I’ll just summarize that here. The market thinks 75 bps hikes in July and September are possible. This follows the 50 bps hike in June, when the Governing Council said in its statement that it “is prepared to act more forcefully if needed to meet its commitment to achieve the 2% inflation target.”
Most of the forecasters in Bloomberg expect a 75 bps hike. The overnight index swap (OIS) market is forecasting 2.27%, i.e. a 77 bps hike! That would mean 75 bps is a certainty and there’s a tiny chance of 100 bps.
The OIS market forecasts a 65 bps hike in September, i.e. 50 bps for sure and a good chance of 75 bps.
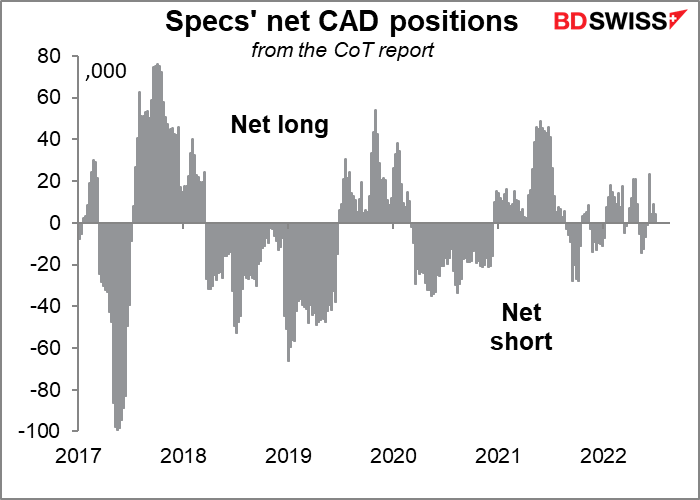
What do I think they’ll do? Headline inflation is at its highest level since 1983 while all three of the Bank’s core measures are above the Bank’s 1%-3% target zone. Moreover, the BoC’s quarterly survey showed that 78% of the people expect inflation to be above the target zone next year too. When two-thirds of the respondents have lost confidence in the Bank’s ability to hit its target, they have to do something aggressive lest they risk inflation expectations becoming unanchored. I therefore expect a 75 bps hike, which is likely to cause CAD to appreciate as speculators add to their small long positions.
The Fed releases the “Summary of Commentary on Current Economic Conditions,” aka The Beige Book as always two weeks before the next FOMC meeting. It’s significant for the market because the first paragraph of the statement following each FOMC meeting tends to mirror the tone of the Beige Book’s characterization of the economy. The book doesn’t have any number attached to it that quantifies its contents, but many research firms do calculate a “Beige Book index” by counting how many times various words appear, such as “uncertain.” In any case, the book is largely anecdotal so you’ll just have to watch the headlines as they come out.
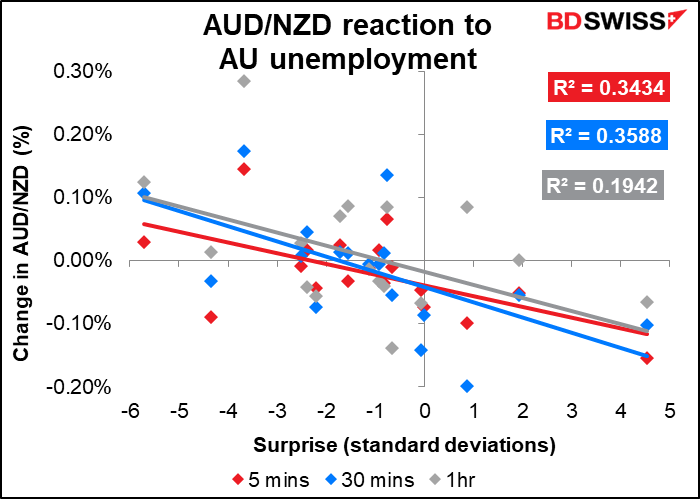
Then overnight Australia releases its employment data. Employment is expected to be up by 30k, which is just a bit below the six-month average of 46k.
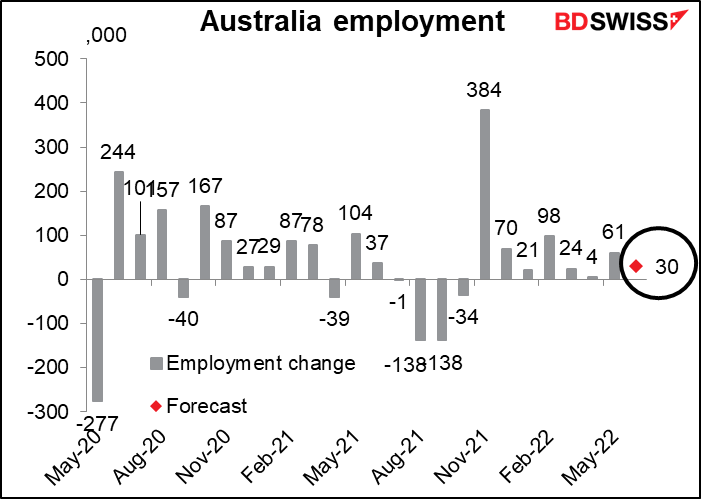
If employment growth is slowing though it may be, like in the US, due to a absence of job seekers. The unemployment rate, which is now at a record low of 3.9%, is expected to slip to an even lower record of 3.8% with the participation rate unchanged.

How to play this indicator: If you’re interested in taking a position with regards to this indicator, you should definitely trade AUD/NZD not AUD/USD and you should watch the unemployment rate rather than the change in employment, which doesn’t have a statistically significant relationship.
Source: BDSwiss