Rates as of 05:00 GMT
Market Recap
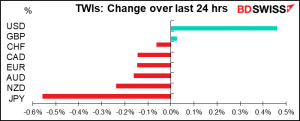
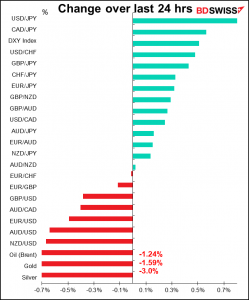
Expectations of faster US growth causing higher US inflation and higher US interest rates pushed the dollar up and JPY down. Other currencies basically just went along for the ride.
It’s noticeable that gold and silver both lost ground, contrary to what one might expect if you think of gold as a hedge against inflation. It may be a hedge against inflation but it’s not a hedge against higher interest rates.
The factor underlying all these moves is of course today’s speech by President Biden unveiling his new infrastructure plan, part of his “Build Back Better” agenda. The Washington Post had some new details about it today. They said the plan would involve around $2.25tn in new spending spread out over eight years, paid for by tax hikes on companies and wealthy individuals (mostly reversing the 2017 tax cuts) that would offset the new spending over 15 years.
According to the WP, the plan involves approximately $650bn to rebuild the country’s infrastructure, such as roads, bridges, highways, and ports; some $400bn toward home care for the elderly and the disabled; $300bn for housing infrastructure; and $300bn to revive US manufacturing. It will also include funds to strengthen the electric grid, develop nationwide high-speed broadband, and ensure clean drinking water everywhere, among other major investments. There will also be approximately $400bn in clean-energy credits on top of the $2.25 trillion in new spending.
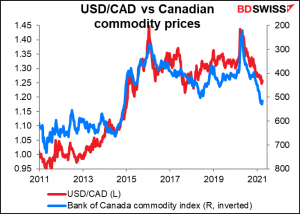
This resource-intensive investment program should benefit the commodity currencies. I would think CAD might be a particularly beneficiary thanks to the close connection between the US and Canadian economies, which results in significant spillovers from US activity into demand for Canadian products.
The plan is only the first of a two-part package. The administration will introduce in a few weeks a second legislative package that will include more “family-oriented” programs, such as an expansion in health insurance coverage, an extension of the expanded child tax benefit, and paid family and medical leave. White House officials have not explained whether they will seek to have both efforts pass at the same time or try to get Congress to approve one first. The combined price tag of the plans could top $4tn.
Yesterday I mentioned that Standard & Poor’s predicted the plan would create 2.3mn jobs by 2024, inject $5.7tn into the economy, and raise per-capita income by $2,400. However, after further digging I found that the article I was quoting from was wrong! The actual article by S&P refers to “a $2.1 trillion infrastructure program, similar in size to the $2 trillion proposed by President Biden as a candidate…” So a $4tn program, i.e. double the size of the one S&P was evaluating, might arguably have double the impact!
Of course with fiscal policy doing much of the heavy lifting, monetary policy may be able to be pared back earlier than many people – including those on the Federal Open Market Committee (FOMC) – think. Their forecasts are made on a ceteris paribus – all things remaining the same – basis. If something substantial changes, their forecasts may well change too. Certainly if they’re waiting for unemployment to get back to previous levels and all of a sudden a program appears that will reduce unemployment by some 3mn people, that’s likely to change their estimate of how long it will take to recover the 8.5mn jobs necessary to get back to the previous peak.
The large fiscal stimulus in the US contrasts with the slow rollout of the Next Generation EU Recovery Fund. What with delays in ratifying the joint borrowing power in many countries plus slow progress in developing national recovery plans, it looks likely that the first tranche of the fund won’t be disbursed until Q4. That compares poorly with the speedy response in the US, where checks should already be in the mail from the $1.9tn package passed recently. The contrast is likely to weigh on EUR/USD.
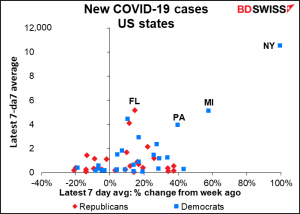
Anyway, that’s the good news about the US. On the other hand, there is a growing fear in the US (and elsewhere) about the recrudescence of the virus. (I never dreamed I’d get to use that word so often!) The director of the Centers for Disease Control and Prevention (CDC) Monday warned of “impending doom” from a potential fourth surge. The headline in the New York Times read:

As the graph below shows, while the absolute number of new cases in many states is still relatively low (Y-axis), the rate of increase is alarmingly high. New York state leads the way with an increase of almost 100% in just one week. Fifteen of the 52 states and territories have seen increases of 20% or more in the last week, while only 16 have seen a decrease of any size. This bodes ill for the outlook for the US economy. And I daresay some places in Europe aren’t necessarily doing much better.
The outlook for the pandemic in Europe is worsening as there was a further setback for the vaccination program. Germany’s Chancellor Merkel announced that the country will suspend use of the Oxford/AstraZeneca vaccine in those under 60 after a German medical institute registered 31 cases of a rare blood clot in the brain after people received the vaccine. Merkel and French President Macron have reportedly discussed with Russian officials the possibility of using Russia’s Sputnik Covid-19 vaccine, although it hasn’t yet been approved by the European Medicines Agency. The problems with the O/AZ vaccine, the cheapest and easiest to store, will slow the vaccine rollout in Europe and thereby slow the Continent’s economic recovery. This is negative for the euro.
In contast, the UK Office of National Statistics (ONS) estimated that over half of the population in England had tested positive for antibodies, meaning that they’d either been vaccinated or had the virus themselves. This suggests the UK is well on its way to attaining herd immunity, with all that implies for economic activity – and GBP.
The virus is weighing on the outlook for oil. There will also be a meeting of The Organisation of the Petroleum Exporting Countries (OPEC) today, followed by a joint meeting with the group’s non-OPEC partners tomorrow – the so-called “OPEC ” group. A panel of technical experts – the OPEC Joint Technical Committee — met yesterday and revised down their estimate for oil demand this year due to rising virus infections and “lockdown measures and travel restrictions being reimposed in many regions.” The downward revisions are most pronounced from April to June, when on average consumption is now see as 1mn barrels a day (b/d) lower than previously estimated. Given this analysis, it’s likely that the broader group will agree to keep production unchanged in order to continue running down global inventories. That could boost oil prices – and CAD – today.
Today’s market
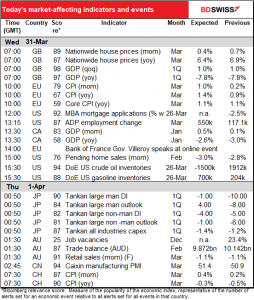
Note: The table above is updated before publication with the latest consensus forecasts. However, the text & charts are prepared ahead of time. Therefore, there can be discrepancies between the forecasts given in the table above and in the text & charts.
The EU-wide consumer price index is expected to accelerate sharply at the headline level – leaping 1% mom – although not so much at the core level (excluding fresh food and energy), where the annual rate of increase is forecast to remain the same.
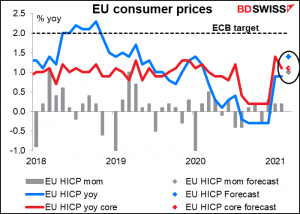
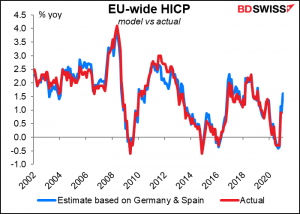
The consensus forecasts were made before yesterday’s German CPI, which came in exactly in line with consensus at 2.0% yoy, up from 1.6%. On the other hand, Spanish CPI was up 1.2% yoy, slightly faster than 0.9% forecast. Using those two as a basis, the index is likely to be up 1.6% yoy, slightly faster than the consensus estimate of 1.4% yoy. (Although the standard error of this calculation is 0.22 points, meaning the actual figure could easily be anywhere between 1.4% and 1.8%.)
The ECB’s recently revised forecasts for inflation are 1.5% this year, 1.2% next year and 1.4% in 2023 – all below their target. Their explanation was:
Inflation has picked up over recent months mainly on account of some transitory factors and an increase in energy price inflation. At the same time, underlying price pressures remain subdued in the context of weak demand and significant slack in labour and product markets. While our latest staff projection exercise foresees a gradual increase in underlying inflation pressures, it confirms that the medium-term inflation outlook remains…below our inflation aim.
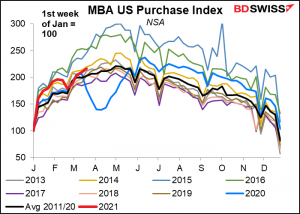
No forecast for Mortgage Bankers’ Association (MBA) mortgage applications to buy a house. So far this year, mortgage applications are running a little bit above average.
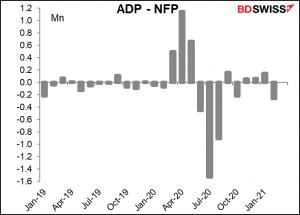
The main feature during the US day is the ADP employment report. Automated Data Processing Inc. (ADP) is an outsourcing company that handles about one-fifth of the private payrolls in the US, so its client base is a pretty sizeable sample of the US labor market as a whole. It’s therefore watched closely to get an idea of what Friday’s US nonfarm payrolls (NFP) figure might be.
The market is looking for the ADP to report an increase in jobs of 550k, vs th consensus forecast for the NFP of 643k. I have no idea why there’s a difference between the two forecasts.
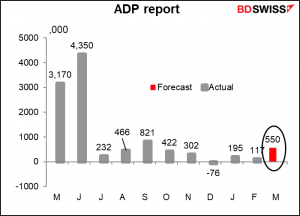
One point to note: the ADP adjusts its figures to match the final estimate of NFP, not the initial estimate that we get this Friday. So while it’s one of the best guides to the NFP that we have, it’s not perfect by any means – in fact, neither is the NFP figure itself, since it’s always revised. For example, the ADP had a remarkably bad estimate in January (in percentage terms) when it estimated 195k new jobs vs only 49k for the NFP. But the NFP was later revised up to 166k, meaning the ADP report was a better forecast of the final NFP figure than the initial NFP was! Otherwise, if we look at in in percentage terms, the recent performance of the ADP as a predictor of the NFP hasn’t been much different than before the pandemic…
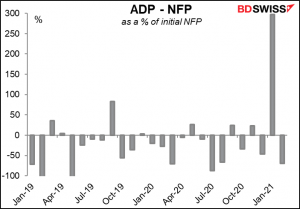
…although of course with the numbers being so big, the actual discrepancy has been larger than usual sometimes
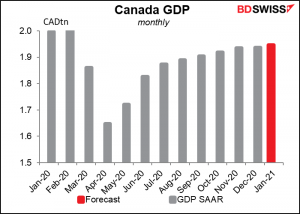
Canada’s monthly GDP is expected to show a robust 0.5% mom increase, in line with flash estimates. The figure is particularly respectable in light of lockdowns in part of the country and reduced auto production during the month. The booming housing industry seems to be picking up some of the slack. February is likely to be even better as lockdown measures were lifted during the month
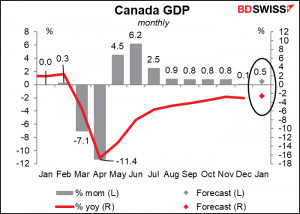
The level of GDP is still expected to be some 2.7% below the pre-pandemic level. It’s getting better, but it’s not quite there yet.
Then overnight we get to another biggie – the Bank of Japan’s quarterly Short-Term Survey of Economic Conditions, universally known by its Japanese acronym, the tankan. This survey is probably the most important economic indicator in Japan. Thousands of Japanese companies are asked about current trends and conditions in their business and their industries as well as their expected business activities for the next quarter and year.
Most of the questions are about whether conditions are getting better or worse, and companies can answer either 1) “better,” 2) “no change,” or 3) “worse.” The BoJ then calculates a diffusion index (DI) by taking the percentage of companies that choose #1 (good, favorable, accommodative, etc.) minus the percent that choose #3 (bad, unfavorable, severe, etc.). The higher the number, the better things usually are, although in some instances, such as production capacity, a lot of excess capacity is not good for the economy.
The result is a dizzying blizzard of data, the most important of which is the business conditions DI for large manufacturers. These companies are the driving force of the Japanese economy (and stock market), the main exporters, and the ones that invest the most. The market looks at three things: 1) what the DI is and how it compares to the previous quarter; 2) how the DI for the current quarter compares with what the firms predicted it would be in the previous tankan (the revision rate); and 3) the projection for the next quarter. The latter statistic is particularly important because it gives an insight into how these companies expect conditions to develop. This is important because if the companies are optimistic about the future, they may step up their investing and hiring people even if current conditions are not so good.
The tankan Dis for the large companies are both expected to rise and the outlook for Q3 is expected to be even better. This would be a good result that could boost confidence in the Tokyo Stock Market and support a “risk-on” mood in Japan that might be negative for the yen, although there is precious little data to go on to see whether that actually happens.
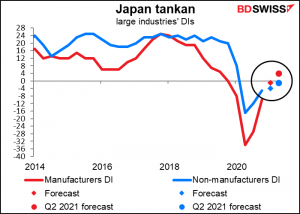
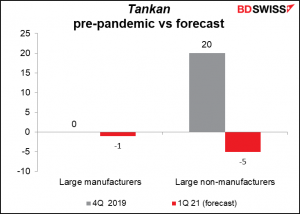
If the consensus forecasts turn out to be correct, it would bring large manufacturers almost back to where they were before the pandemic, but non-manufacturers still have far to go to climb back up.
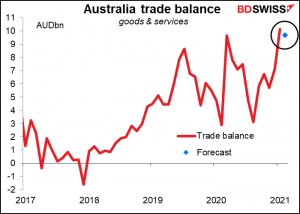
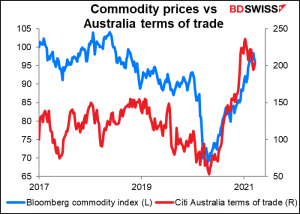
Australia’s trade surplus is expected to decline only slightly from January’s record level.
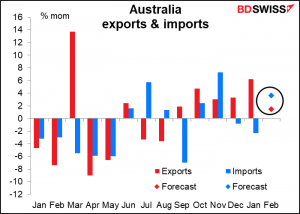
Export earnings are forecast to be up 1.5% mom, much of which is going to be prices – commodity prices rose by over 3% during the month, particularly iron ore. Imports are forecast to rise a faster 3.6% mom, reversing some of the decline in the previous two months.
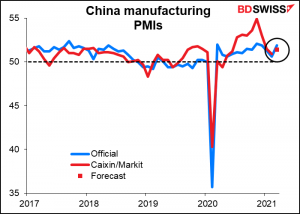
In China, the Caixin/Markit manufacturing purchasing managers’ index (PMI) is expected to rise to 51.4 from 50.9. This would be a little bit below yesterday’s official manufacturing PMI, which rose sharply to 51.9 from 50.6, higher than the 51.2 expected.
I’m not sure whether the Swiss consumer prices have any effect on the exchange rate – my guess is probably no, EUR/CHF is probably more a function of risk sentiment and expectations for the European Central Bank (and Bund yields) than anything having to do with the Swiss economy.
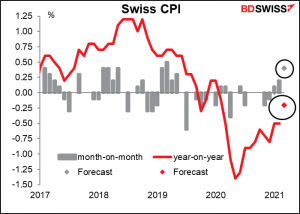
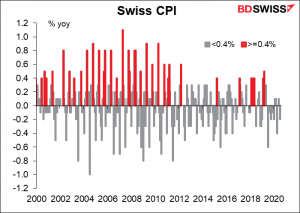
Nonetheless the jump in Swiss prices might give some people pause. The forecast 0.4% mom rise would be the biggest mom increase since 0.5% in March 2019, but saying that underestimates how unusual such a rise would be. Prices have only risen 0.4% or more mom eight times in the 119 months since March 2011.
Personally I don’t see why the Swiss National Bank is so concerned about inflation in Switzerland. The prices there are crazy high, even for some easily traded goods, and should come down. If they can’t make the currency fall fast enough then it’s only natural that prices come down, just as happened in Japan when they began opening up the economy to foreign goods back in the 1990s. EG, at one point the yen was so strong and prices in yen terms were so high that companies were shipping bills and other letters in bulk to Hong Kong and then mailing them international mail back to Japan – that was cheaper than just posting them across Tokyo! It would seem to me that Switzerland would be ripe for the same kind of disintermediation. And I suppose to some degree it is – a lot of people living near the French border do their grocery shopping in France, for example.
Source: BDSwiss