BRENT
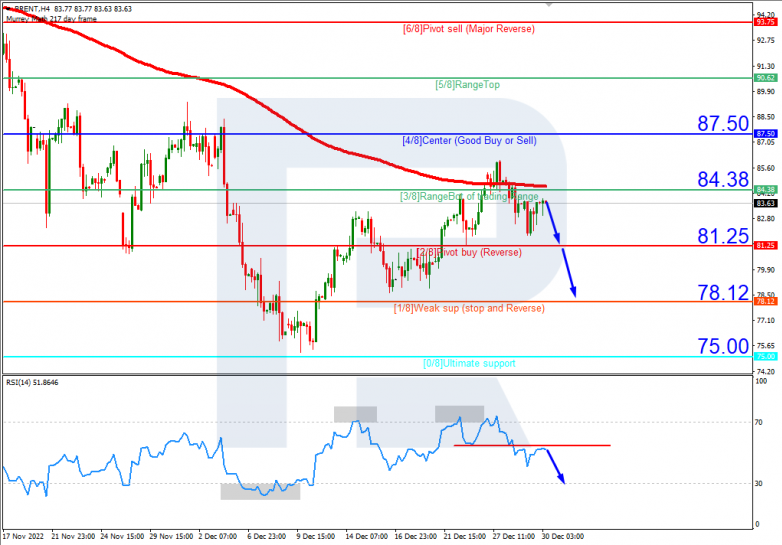
On H4, Brent quotes are under the 200-day Moving Average, which indicates prevalence of a downtrend. The RSI is testing the resistance line. A test of 2/8 (81.25) should be expected, followed by a breakaway and falling to the support level of 1/8 (78.12). The scenario can be cancelled by rising over the resistance level of 3/8 (84.38), which might lead to a trend reversal and growth of the quotes to the resistance level of 4/8 (87.50).

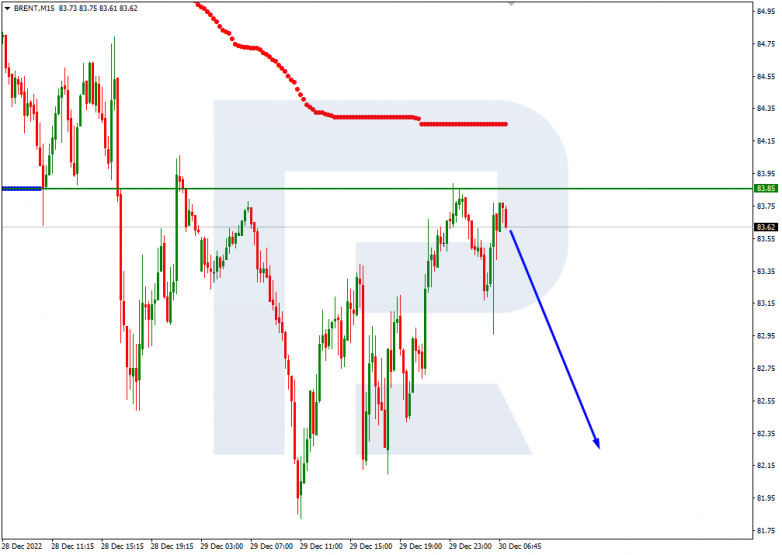
On M15, the lower line of VoltyChannel is broken away, which confirms the downtrend and increases the probability of further falling.

S&P 500
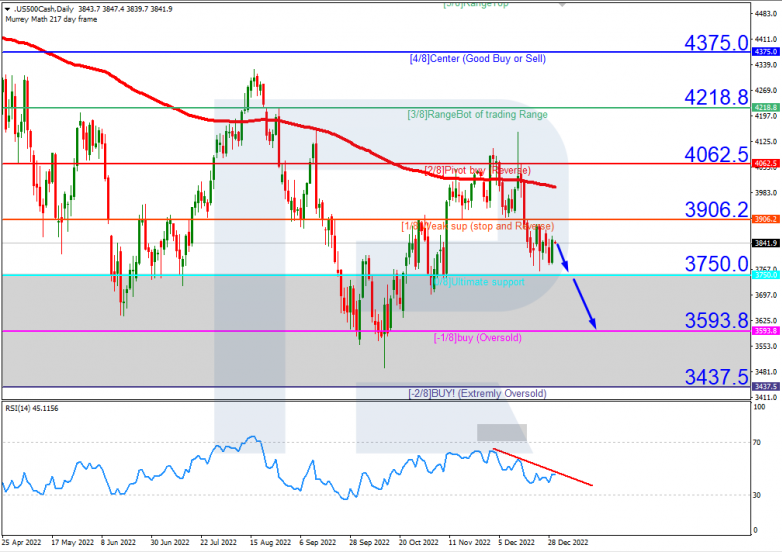
On H4, the quotes are under the 200-day Moving Average, which indicates prevalence of a downtrend. The RSI is testing the descending trendline that acts as a resistance level for the price. As a result, a breakaway of 0/8 (3750.0) is expected, followed by falling to the support level of -1/8 (3593.8). The scenario can be cancelled by rising over the resistance level of 1/8 (3906.2). In this case, the S&P 500 index may rise to 2/8 (4062.5).

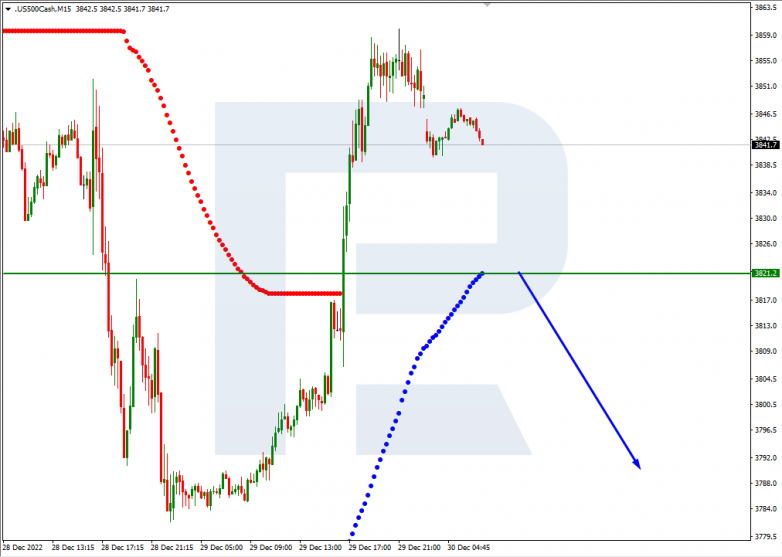
On M15, an additional signal confirming the decline will be a breakaway of the lower line of VoltyChannel.

Forecasts presented in this section only reflect the author’s private opinion and should not be considered as guidance for trading. RoboForex bears no responsibility for trading results based on trading recommendations described in these analytical reviews.