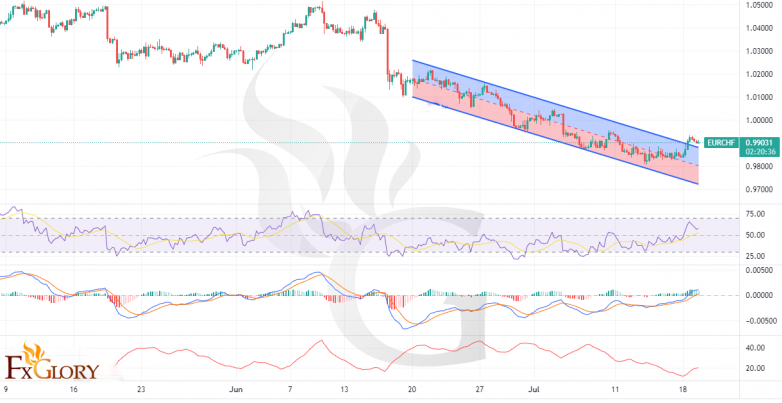
As it is clear in the EURCHF chart, The price was falling for about a month from June 20th until yesterday, EURCHF broke out of the falling channel and it is bout to complete a pullback by retesting the channel. This bullish trend is likely to continue to resistance level 1.00000 and above.The RSI is moving toward the level of 70 and the ADX is showing a rising signal. The MACD histogram is in positive territory with the signals showing an uptrend. Regarding all analysis, the best entery is when the pullback is completed and the level is retested
• There is resistance at 0.10050 followed by resistance at 0.10150 and 0.12000
• There is support at 0.98800 below, there is 0.98200 and 0.98000.
Note: We do not suggest any investment advice, and these analyses are just to increase the traders’ awareness but not a certain instruacdtion for trading.
FxGlory - News