Rates as of 05:00 GMT
Market Recap
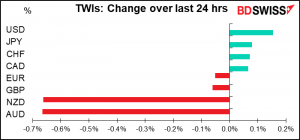
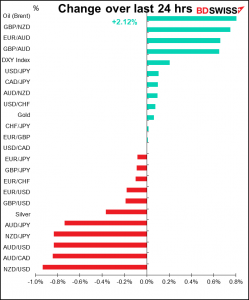
Rarely have I seen a day when two currencies stood out like this.
Looking at the timing of the move down, it clearly wasn’t due to any particular news out of Australia or New Zealand. Nor was it due to the US indicators, since the big plunge came at 14:57 GMT whereas the US indicators were released at 13:30.
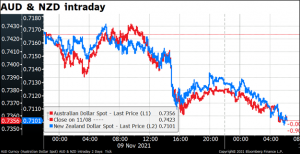
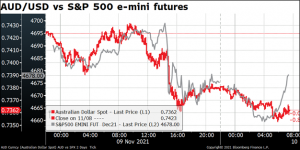
Rather, the move coincided with the drop in stocks in the US. So it was the result of a general “risk-off” day that hit the growth currencies far more than the “safe-haven” currencies.
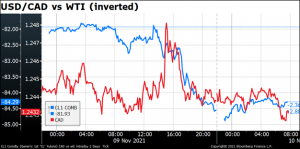
CAD was dragged along at first but then escaped because of the 2.9% rise in the price of West Texas Intermediate (WTI), the benchmark US crude oil.
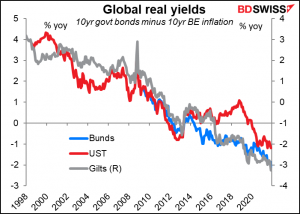
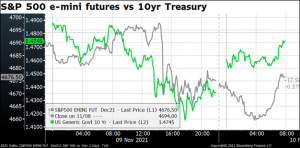
We were looking forward to getting nine days in a row of higher stock prices in the US, which would’ve been the longest run since 2004. Alas it was not to be as stock prices fell, as did bond yields. The latter is an odd move when the big fear in the world is higher inflation. Ten-year yields fell -5.4 bps to 1.44% and the 30-year bond was down -6.4 bps to 1.82% (although yields are coming back this morning – see below). The fall in Treasury yields was driven entirely by a decline in real yields, not just nominal. The 10-year real yield fell 8 bps to -1.21%, its lowest closing level since Treasury Inflation Protected Securities (TIPS) began trading in the late 1990s (same for the 30-year real yield).
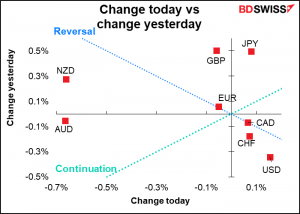
As for what caused the drop in stocks and the decline in yields…I don’t think anyone knows for sure. I read several market comments from several sources. Most either ignored the whole question or expressed confusion. I couldn’t find any obvious reason either – perhaps just markets feeding off each other. Nevertheless, it seems to be reversing this morning with both stocks and bond yields headed higher – perhaps we can expect some mean reversion in AUD and NZD today.
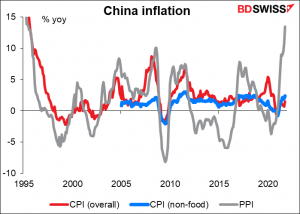
Overnight, China’s inflation data beat estimates, with the headline CPI rise 1.5% yoy (1.4% estimate) and the producer price index (PPI) especially rising 13.5% yoy (estimate 12.3%), the highest since July 1995. This has increased the odds of a higher-than-expected US inflation figure today (see below).
The rally in real yields was particularly odd as oil prices surged further. Inflation expectations are tied tightly to oil prices; indeed sometimes they seem to be simply a function of the oil price. Natural gas however was down 8.5% in US trading; maybe that helped.
Today’s market
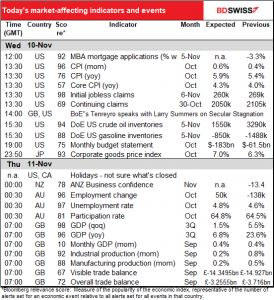
Note: The table above is updated before publication with the latest consensus forecasts. However, the text & charts are prepared ahead of time. Therefore there can be discrepancies between the forecasts given in the table above and in the text & charts.
A quiet day in Europe, during which you can contemplate the wisdom of the European Finance Ministers yesterday, who accomplished…hmmm…
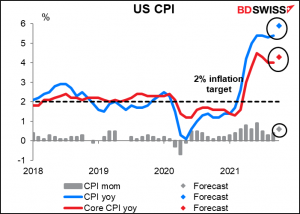
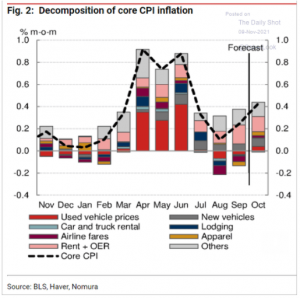
So we’re basically just waiting for the US day to begin and assault us with the US consumer price index (CPI). It’s expected to move substantially higher, close to 6% yoy for the headline figure, a rate that hasn’t been hit since December 1990, i.e. the highest in 30 years. That’s not what any central banker wants on his or her record.
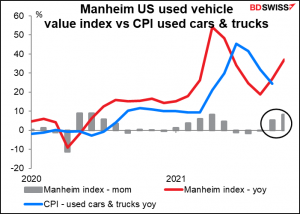
The main driver of this increase so to speak is likely to be new and used cars once again. These little devils accounted for about one-third of the increase in inflation a few months ago, which is pretty dramatic. Although the CPI for used cars & trucks came down in August and September, the Manheim auction price rose again in September and October. This private-sector index tends to lead the CPI component by two months, so it will soon begin feeding through to the CPI.
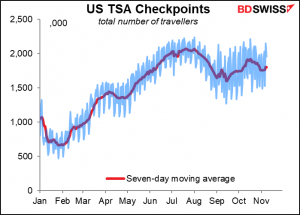
On the other hand, some Covid-sensitive sectors such as hotels and airfares saw prices fall during the late summer as the surge in Delta cases slowed the recovery in travel.
People will also be paying a lot of attention to rents. Both primary and owners’ equivalent rent spiked in September, rising by 0.45% mom and 0.43% mom respectively. The increase seemed to be confined to the southern US though. People will want to see if it remains high and if it starts to spread to other areas. It’s likely to, in my view, because rents tend to follow house prices by around six months and house prices have continued to go up. Rent accounts for about one-third of the “basket” of goods and services that the CPI is based on, so it has an outsize effect on the index. Fed Gov. Brainard, who’s being considered for the new Fed Chair when Powell’s term ends next February, recently highlighted rental inflation as the key to her assessment of the risks around the inflation outlook.
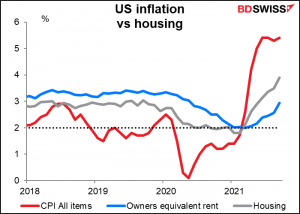
Rents were the biggest single factor in pushing up the inflation rate for the last two months and seem likely to be the biggest factor this month again.
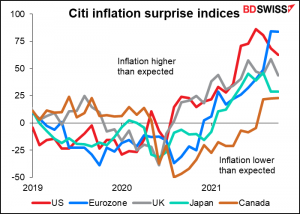
What will be the market impact of the CPI? I’m not sure it will have much impact at all at this point. That’s for two reasons. First, inflation has been surprising on the upside almost everywhere for months. Higher inflation is the norm nowadays. Secondly, the Fed is focused on the labor market, not inflation. It’s not going to accelerate its tapering or bring forward “lift-off,” the time when it starts raising rates, unless the labor market improves substantially or inflation starts getting really out of hand.
Nonetheless, a rise in inflation could at the margin cause some people to reevaluate their view on Fed tightening and therefore it could be positive for the dollar.
Speaking of which, the betting odds on Powell getting reappointed have been lengthening recently but he remains the overwhelming favorite. He’s going for 71 cents vs 30 cents for Brainard on predictit.org (81 cents vs 20 cents on kaishi.com).
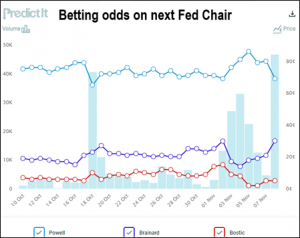
The general view is that Brainard will replace Quarles as Vice Chair of Supervision and maybe that will quiet those who object to Powell’s reappointment, such as Senator Warren, since she’s criticized the Fed for being too lenient in supervising and regulating the banks. I think that many if not most Republicans would vote to reappoint Powell since after all he’s a Republican appointed by a Republican president, so a couple of Democrats voting “no” wouldn’t matter.
I think Powell being reappointed wouldn’t have much impact on the market as that’s the status quo and the consensus. But if by some chance President Biden decides he wants a Democrat in charge at the Fed, much like the Republicans have taken over the Supreme Court, that could disrupt the market. I think investors would assume Gov. Bainard would be even more dovish than Chair Powell and so the dollar would probably fall while stocks rallied, even though in fact a) Powell was plenty dovish himself – I’m not sure there’s that much difference between them — and b) there’s a limit to what either of them can do anyway because of the Fed’s mandate.
There are two other openings on the Board of Governors if President Biden wants to make an impact.
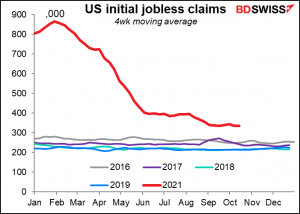
At the same time as the CPI comes out, we get the weekly US jobless claims.
The dreaded initial jobless claims are expected to continue with their minuscule weekly decline – this time -9k, which just happens to be the average for the last three weeks. It looks like this series is bottoming out again.
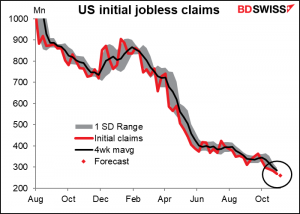
Nonetheless they’re not a million miles from a normal level anymore.
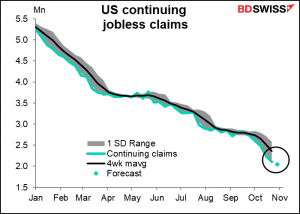
Meanwhile continuing claims continue to decline and are expected to continue continuing this week, too, although at the more modest pace of -55k vs an average of -156k a week for the last four weeks.
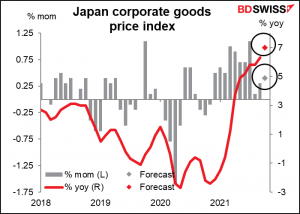
Then overnight in Japan we get the corporate goods price index, aka producer price index. It’s got a huge Bloomberg relevance score so I include it here but I suspect that’s more from equity investors, for whom this is an indicator of how corporate profit margins are developing, rather than for FX investors, as this hasn’t any chance to influence monetary policy.
The index is expected to rise a staggering 7% yoy, which contrasts sharply with the Lilliputian (a word I had to use after managing to sneak in Brobdingnagian yesterday) 0.2% yoy increase in the consumer price index. Somebody’s profit margin is likely to get squeezed here.
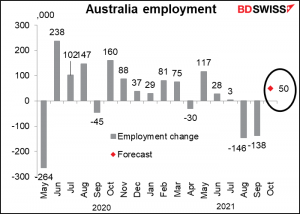
Then Australia announces its employment data. This is particularly important for Australia because the Reserve Bank of Australia has a “dual mandate” that requires it to “best contribute to (a) the stability of the currency of Australia and (b) the maintenance of full employment in Australia” (actually it has a “triple mandate” as it’s also required to look out for “(c) the economic prosperity and welfare of the people of Australia”).
Employment is expected to rise slightly after two months of declines.
However the unemployment rate is expected to rise slightly as more people come back into the labor force as the country exists lockdown.
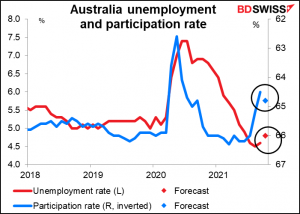
The lockdowns will complicate the interpretation of the data. The first week of the two-week survey period, New South Wales, the most populous of the country’s states, was in lockdown, but the lockdown was lifted during the second week. Victoria, the second-most populous, was in lockdown throughout the survey period. We’ll have to wait until the November figures to get a totally “clean” view of the employment situation.
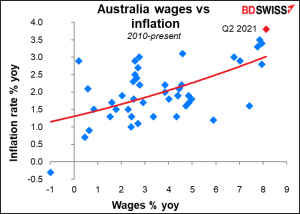
The RBA is worried not so much about the level of employment as it is with wages; it argues it will need “wages growth that is materially higher than it is currently” to generate inflation in the 2%-3% target range on a sustained basis. That seems a little strange since the latest data (for Q2) showed wages up 8.1% yoy and inflation up 3.8% yoy, but they probably assume that this is just temporary dislocations caused by the pandemic and base effects and wage growth will slip back to more normal levels once the lockdowns end.
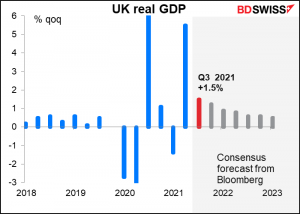
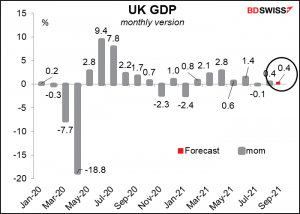
Then Thursday morning at 7i o’clock as the day begins, the UK has “short-term indicator day,” so-called because these indicators give a feel for where the economy is in the near term. The biggie this time is Q3 GDP.
After an extremely strong Q2, 5.5% qoq, the UK economy has slowed notably (and is expected to slow further). The economy actually contracted in July (-0.1% mom) and growth was disappointing in August too ( 0.4% mom). With September also expected to be a lackluster 0.4% mom, growth for the quarter as a whole is forecast to be 1.5% qoq, a big slowdown from Q2. Slowing household consumption and government spending is the reason behind the slowdown, with a small negative contribution from trade as well.
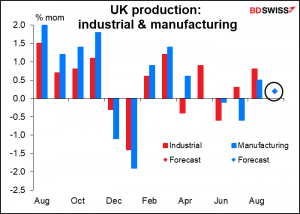
The forecasts for industrial production and manufacturing production alone are both exactly the same, both mom and yoy, which is why it looks like there’s only one dot on the graph for the forecasts.
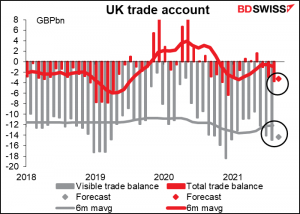
The UK trade deficit is expected to narrow slightly, but I’m not sure that’s good news. My guess is that it would be because the country’s imports are being held up thanks to red tape at the border & a lack of drivers, problems that have arisen thanks to Brexit.
Source: BDSwiss