Rates as of 05:00 GMT
Market Recap
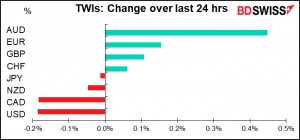
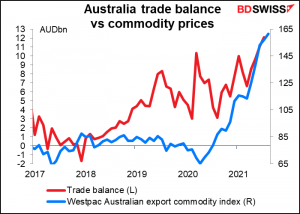
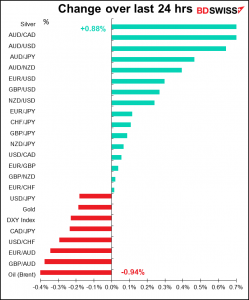
AUD was the big mover over the last 24 hours. The move began with an almost vertical rise in AUD/USD around 06:00 GMT yesterday, i.e. just as European trading got started, and continued until 16:35 GMT, i.e. the end of the European day. The pair sagged after that but in the last couple of hours has come back up, perhaps boosted by this morning’s news of a record trade surplus in July, boosted by rising commodity prices (which rose further in August, according to the Westpac index of the commodities that Australia exports).
The big question for AUD is what will the Reserve Bank of Australia (RBA) decide next Tuesday? I’ll be looking at that today and write about it in tomorrow’s Weekly Outlook. On the one hand, last time they were quite sanguine about the effects of the lockdown and didn’t seem fazed by it at all, but on the other hand, the lockdown(s) have been more widespread and longer than they had expected. On yet another hand, Q2 GDP beat expectations… Oh to be the proverbial one-handed economist!
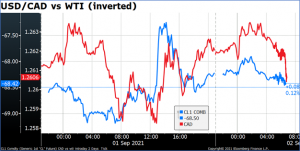
Oil was lower and dragged CAD down, much to my surprise, following the decision by OPEC to stick with their plan to raise output by 400k barrels a day (b/d). Since this increase was already decided and the news reports ahead of time said that everyone expected the decision to be affirmed, I hadn’t expected the news to move the market at all. If anything, there were calls from the Biden administration to increase output faster, so I thought there was a chance the decision to stick with the plan might boost oil prices. But apparently some people thought that they might slow the output increases in the face of lingering concerns about the spread of the virus.
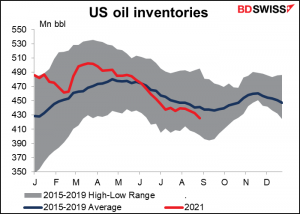
The fall in oil is especially surprising given yesterday’s US Energy Information Agency report saying that oil inventories had fallen by 7.2mn barrels in the latest week, far more than the 2.5mn bbl that the market expected (or the American Petroleum Institute’s 4.0mn bbl decline).
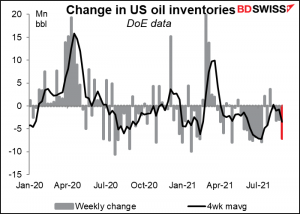
Oil inventories in the US are below average for this time of year (note that the graph doesn’t use 2020 data as that was an extraordinary year). In fact they’re the lowest they’ve been for almost two years.
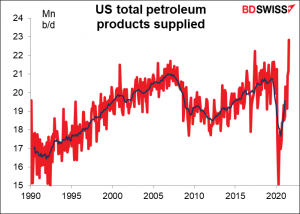
In addition, total petroleum products supplied – a proxy for demand – hit the highest on record (data back to 1990).
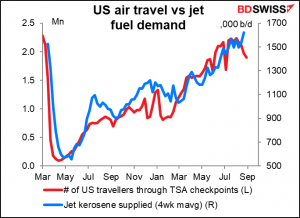
Mobility seems to be increasing in the UK, EU, and US, except of course in Australia, where a lot of the country is in lockdown.

Although there are some signs that demand for air travel in the US is starting to wane, which could impinge on demand.
As I said, CAD followed oil down, but this morning CAD is recovering – perhaps people are reading the morning papers and starting to think as I do about the outlook for oil?
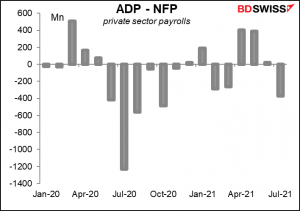
USD was lower after the ADP report missed massively, coming in at 374k vs 625k expected. That raised expectations that tomorrow’s US nonfarm payrolls may come in below forecasts too, which could delay Fed tapering, which is why bond yields fell, which is why the dollar fell.
But bear in mind what I said yesterday about the ADP report being a pretty poor forecaster of the NFP. This year the ADP report has ranged from 403k over the NFP in April to 373k below last month. That’s 185% above to 53% below. So I don’t think it has many implications for the NFP. USD may well rebound today.
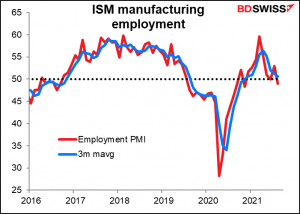
On the other hand…(yet again)…the employment component of the Institute of Supply Management’s manufacturing purchasing managers’ index (PMI) slipped into contractionary territory at 49.0. That added to the question marks over the NFP (even though the ISM manufacturing PMI itself beat expectations, unexpectedly rising to 59.9 from 59.5 vs a fall to 58.5 expected).
Today’s market
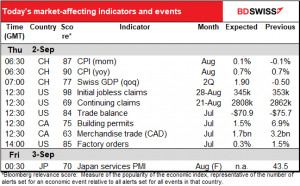
Note: The table above is updated before publication with the latest consensus forecasts. However, the text & charts are prepared ahead of time. Therefore there can be discrepancies between the forecasts given in the table above and in the text & charts.
The European day’s excitement is already over, so now we’re just waiting around until the dreaded US weekly jobless claims come out.
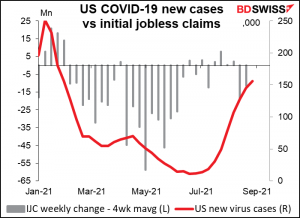
Initial claims were up slightly last week ( 4k). They’re expected to be down slightly (-8k) this week. As you can see from the graph, the rate of change has slowed considerably since last June. Overall they haven’t decreased much since then.
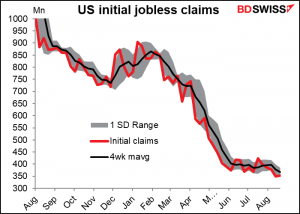
The stagnation in initial claims coincided with an upturn in new COVID-19 cases.
Continuing claims continue to decline, however here too we’re seeing some slowdown recently – odd since so many states have been ending their extended federal unemployment benefits early. The forecast for this week is -54k, which would be a big improvement from last week’s meager -3k.
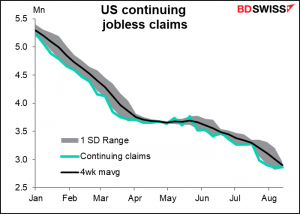
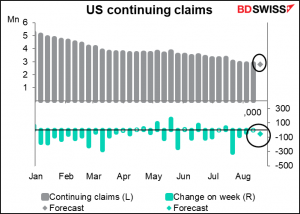
In any event, continued improvement (= reduction) in initial & continuing claims would suggest improvement in the labor market, which brings tapering closer = USD-negative.
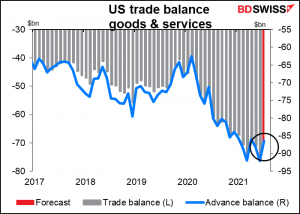
The US trade deficit (trade in goods & services) is forecast to narrow a bit, which is a no-brainer given that the advance trade balance (trade in goods alone) narrowed by $5.7bn during the month. Since trade in services doesn’t change much from month to month, the change in the overall balance is largely determined by the change in visible trade. In theory a narrower trade deficit should be positive for USD but really nobody cares.
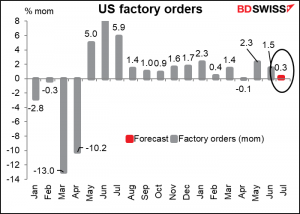
US factory orders are expected to be up but only marginally, no surprise since durable goods orders were down marginally (-0.1% mom). A small rise in the face of a small fall in durable goods orders might suggest that demand is better than it seems and the expansion has legs, which would be USD-positive. (The two move in the same direction 87% of the time; only 17% of the time that durable goods orders are down are factory orders up.)
Source: BDSwiss