Previous Trading Day’s Events (27.03.2024)
- Federal Reserve Governor Christopher Waller said there is no rush to lower interest rates, emphasising that recent economic data warrants delaying or reducing the number of cuts seen this year.
Waller described recent inflation figures as “disappointing” and said he wants to see “at least a couple months of better inflation data” before cutting. The Fed has room to wait to gain confidence that inflation is on a sustained path toward the 2% target since the economy is strong.
“In my view, it is appropriate to reduce the overall number of rate cuts or push them further into the future in response to the recent data,” Waller said in prepared remarks Wednesday before the Economic Club of New York titled “There’s Still No Rush.”
Fed officials are debating when and to what extent to lower borrowing costs this year. Chair Jerome Powell has called the timing of such a decision “highly consequential” and emphasised the need for patience.
The economy experiences resilient growth, and Fed policymakers significantly boosted their estimate for gross domestic product this year to 2.1%, up from 1.4% in December. Hiring has remained strong, and key price gauges have exceeded economists’ expectations in recent months.
The government will release data on the Fed’s preferred inflation metric on Friday. PCE Price Index.
Source: https://www.reuters.com/markets/us/feds-waller-still-sees-no-rush-cut-rates-amid-sticky-inflation-data-2024-03-27/
______________________________________________________________________
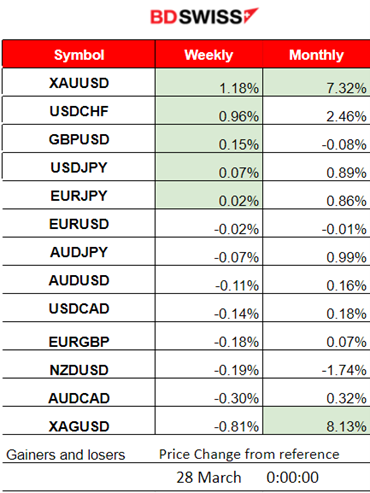
Winners vs Losers
XAUUSD takes the lead with 1.18% gains this week and 7.32% for the month. USDCHF followed with 0.96% gains this week since CHF experienced strong weakening.
 ______________________________________________________________________
News Reports Monitor – Previous Trading Day (27 Mar 2024)
Server Time / Timezone EEST (UTC 02:00)
- Midnight – Night Session (Asian)
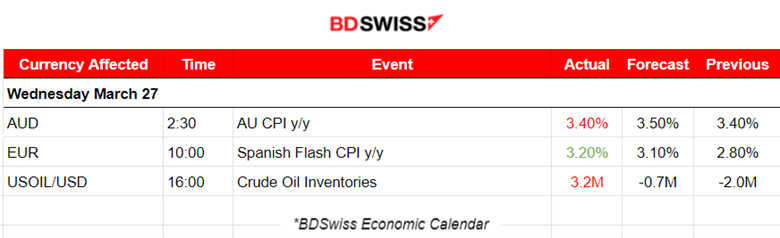
Annual Inflation figures in Australia remained unchanged at 3.40%. The result was below the 3.6% level expected by markets. The market reacted with AUD depreciation starting at 2:00 at the time of the release. The AUDUSD dropped rapidly, nearly 25 pips.
- Morning – Day Session (European and N. American Session)
The estimated annual inflation of the CPI in March 2024 is 3.2%, according to the flash indicator prepared by the NSI. No major impact was recorded in the market.
General Verdict:
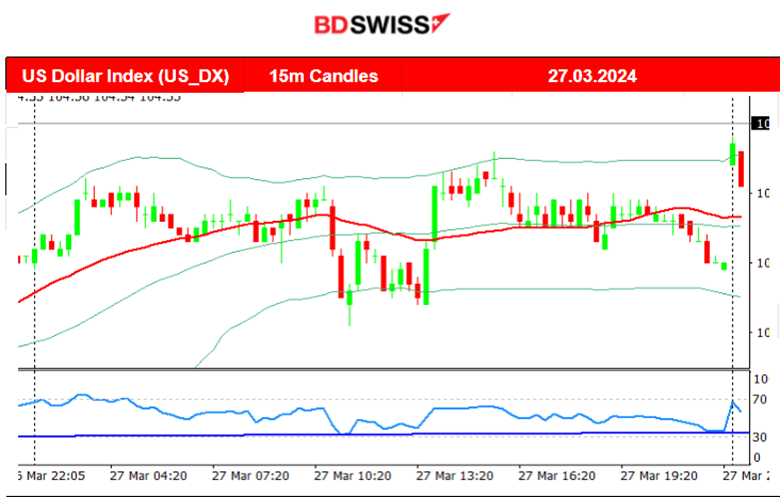
- Unusual volatility in the FX market with the absence of important scheduled releases. The dollar index moved sideways around the mean with low volatility closing near flat for the trading day.
- Gold moved up and tested resistance near 2200 USD/oz level again.
- Crude reversed to the upside.
- U.S. indices experienced high volatility but closed higher overall.
 __________________________________________________________________
FOREX MARKETS MONITOR
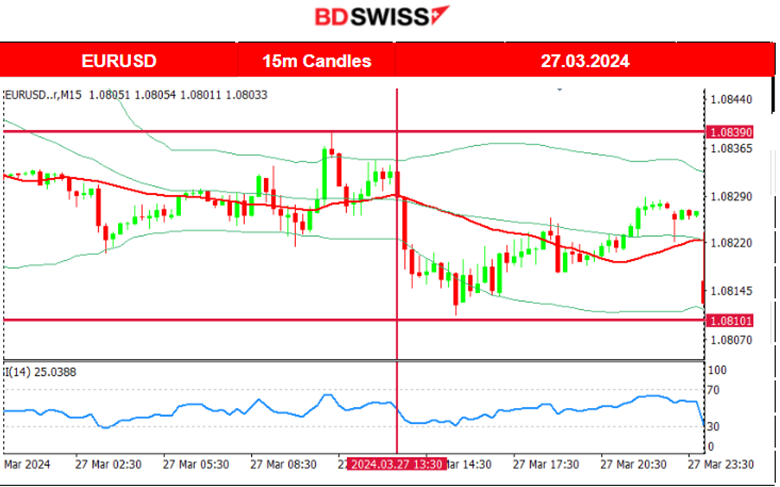
EURUSD (27.03.2024) 15m Chart Summary
Server Time / Timezone EEST (UTC 02:00)
Price Movement
The pair moved with low volatility around the 30-period MA until the start of the European session. After the Spanish Flash CPI data release the pair moved a bit to the upside but found resistance near 1.08390 before reversing to the downside. It found support near 1.08100 and eventually retraced, remaining close to the MA.
 ___________________________________________________________________
CRYPTO MARKETS MONITOR
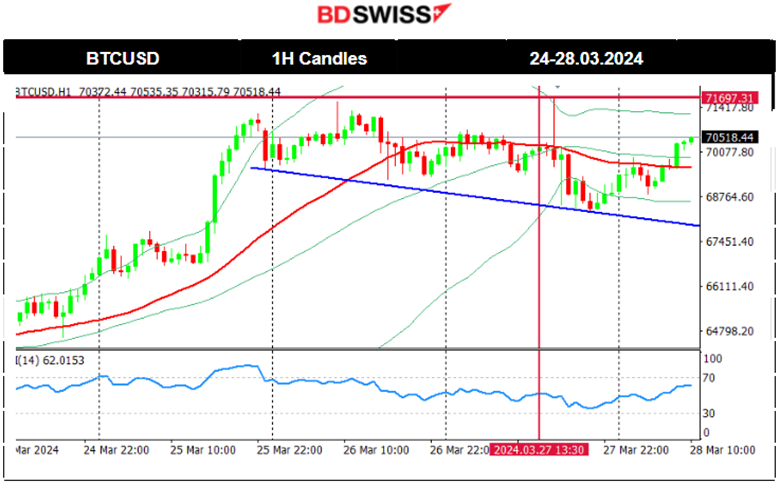
BTCUSD (Bitcoin) Chart Summary 1H
Server Time / Timezone EEST (UTC 02:00)
Price Movement
Bitcoin suffered losses recently dropping from the peak at 74K, and continuing downwards until the FOMC event. After the news and during the press conference, Bitcoin saw a rise, returning back to the mean.
The 10 US spot bitcoin ETFs collectively saw net outflows each day last week and those net outflows slowed later in the week.
Since the 22nd of March, it actually experienced a good comeback with the price moving upwards crossing the 30-period MA on its way up and showing upward momentum. The 68K USD level resistance was breached on the 25th of March and the price moved higher even beyond 70K USD. The 30-period MA turned sideways as the price slowed down, remaining near 71K USD.
 Crypto sorted by Highest Market Cap:
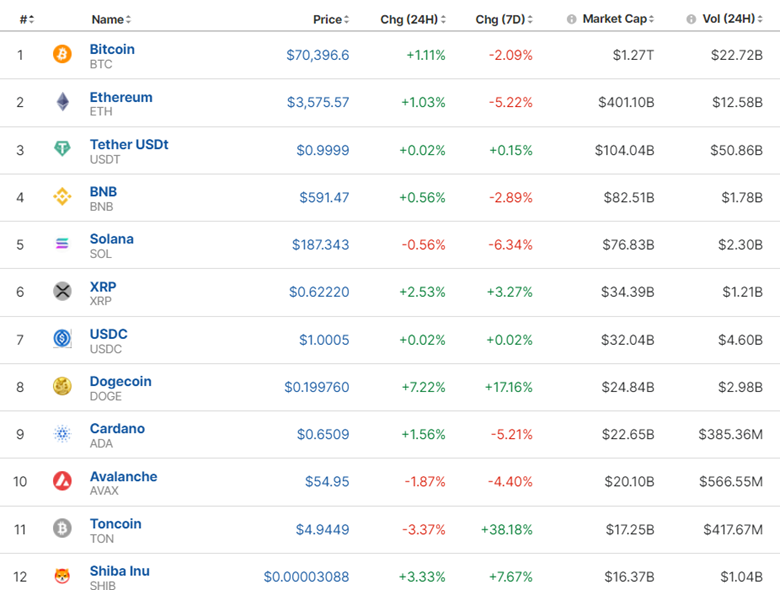
Mixed performance for crypto as net ETF inflows/outflows are back to normal levels.
Source: https://www.investing.com/crypto/currencies
______________________________________________________________________
EQUITY MARKETS MONITOR
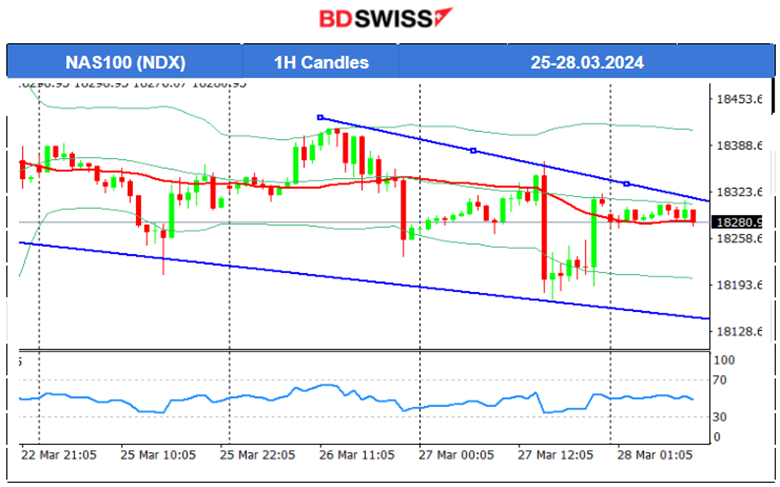
NAS100 (NDX) 4-Day Chart Summary
Server Time / Timezone EEST (UTC 02:00)
Price Movement
After the FOMC event on the 20th of March, all U.S. indices saw a jump. The market’s initial expectation was that borrowing costs would lower soon or as expected this year, sparking this upward movement and resilience to the downside. Soon, however, expectations changed. The dollar saw massive strengthening and the U.S. indices started to drop since the 21st March. The NAS100 is currently showing high volatility moving around a 30-period MA but within a downward channel.
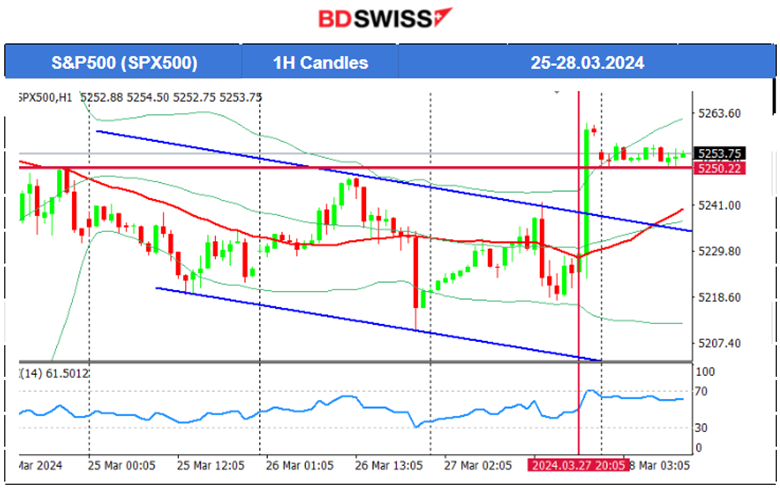
 S&P500 (SPX500) 4-Day Chart Summary
Server Time / Timezone EEST (UTC 02:00)
Price Movement
S&P500 jumped at 21:00 yesterday night. This move broke the channel and it crossed the 30-period MA on its way up. We could see a potential retracement today back to the MA if resistance holds strong. 5,250 USD serves as a support now and its breakout might be the key to unlock a sharp drop.
 ______________________________________________________________________
COMMODITIES MARKETS MONITOR
USOIL (WTI) 4-Day Chart Summary
Server Time / Timezone EEST (UTC 02:00)
Price Movement
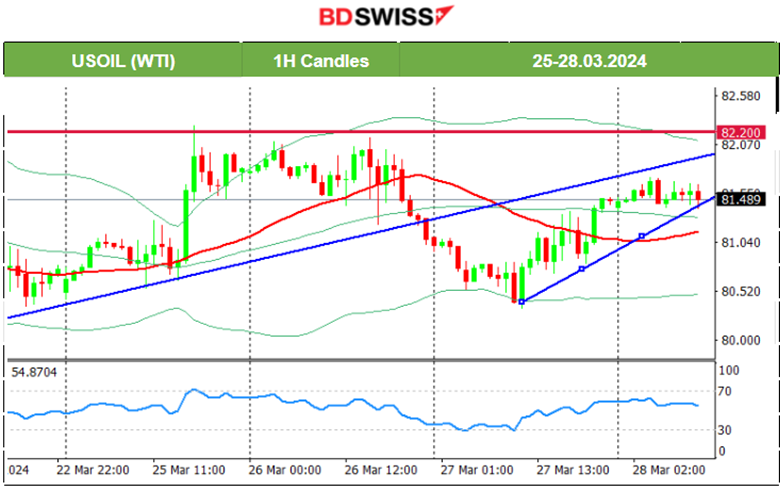
On the 25th of March, Crude oil moved to 82.3 USD/b before retracement followed. After some consolidation period, the price moved to the downside rapidly with a reversal from the upside. This rapid downward movement boosted the probability of a retracement taking place on the 27th of March and it did as predicted in our previous analysis. The price reversed, crossing the 30-period MA on its way up and settled currently near 81.50 USD/b.
 XAUUSD (Gold) 4-Day Chart Summary
Server Time / Timezone EEST (UTC 02:00)
Price Movement
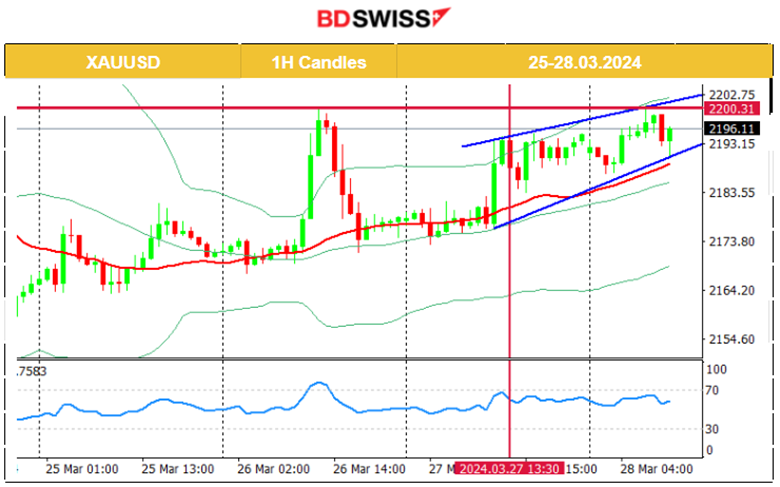
Since the 21st of March Gold moved below the 30-period MA and remained on a downtrend until the 25th of March where it settled near the mean at 2,170 USD/oz. As predicted in our previous analysis, the breakout of the triangle caused a jump in Gold’s price to 2,200 USD/oz on the 26th of March. Intraday reversal followed and Gold settled eventually at near 2180 USD/oz. On the 27th of March Gold saw a rise again and tested the resistance at 2,200 USD/oz again. An upward wedge signals its persistence to move upwards.
 ______________________________________________________________
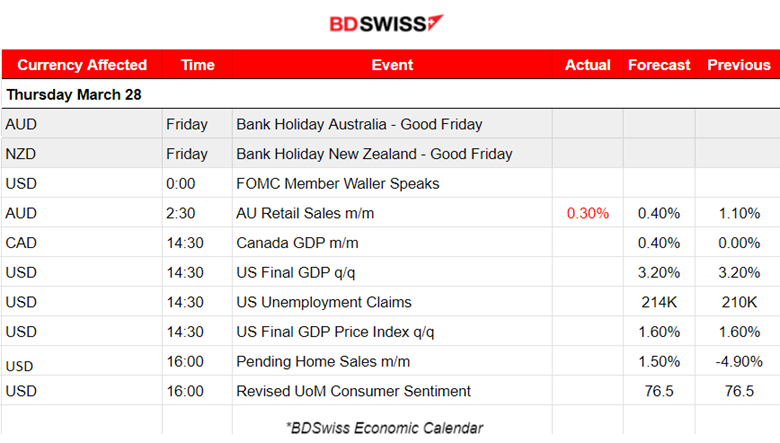
News Reports Monitor – Today Trading Day (28 Mar 2024)
Server Time / Timezone EEST (UTC 02:00)
- Midnight – Night Session (Asian)
Monthly retail sales figures for Australia show 0.30% growth which is less than expected. No major impact was recorded in the market.
- Morning – Day Session (European and N. American Session)
At 14:30 Canada’s monthly GDP growth figure is expected to be reported higher and at the same time, the Final quarterly GDP figure for the U.S. is expected to be reported unchanged. We have also other figure releases at the same time like the U.S. Unemployment claims and the Final GDP price index. USD pairs will probably be affected during this time with an intraday shock even if it is going to be probably a moderate one.
General Verdict:
- The dollar is showing unusual strength. Probably the comments from the Fed’s Waller yesterday. “RISK OF WAITING TO CUT RATES ‘IS SIGNIFICANTLY LOWER THAN ACTING TOO SOON”.
- Gold is following an upward wedge and targets the upside.
- Crude oil not moving and sideways.
- U.S. indices see low volatility currently moving sideways.
______________________________________________________________
Source: BDSwiss