Rates as of 05:00 GMT
Market Recap
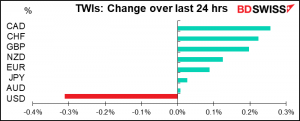
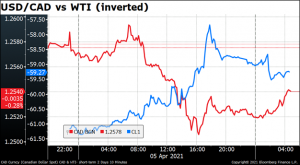
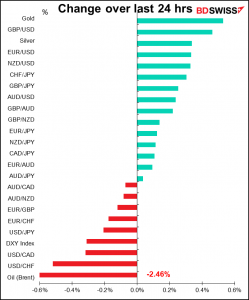
Oh dear…CAD was the best-performing currency yesterday, contrary to what some pundits – notably me – had expected. The usual relationship between USD/CAD and oil prices broke down completely as oil fell (I got it half right!) but CAD rallied, nonetheless.
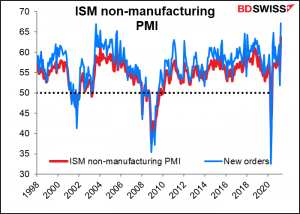
The strong loonie was attributed to the general “risk-on” tone, bolstered by yet another blow-out US indicator (the ISM service-sector PMI) that carried the S&P 500 yet further into record territory yesterday. (The Institute of Supply Management’s non-manufacturing purchasing managers’ index hit a record high, as did the new orders sub-component. The “prices paid” index was the highest in 12 years. Data going back to July 1997.)
But that routine explanation doesn’t explain the dynamics of the market today – why would CHF be #2 in a “risk-on” mood and why would AUD be underperforming so much – even gaining less on a trade-weighted basis than the safe-haven JPY? I have to say I have no clear answers, unfortunately.
The relative underperformance of AUD might have been just some jitters ahead of the Reserve Bank of Australia (RBA) meeting overnight. In the event, the RBA didn’t change policy (I got that one right! But so did virtually everyone else too, so it’s not much of a win.)
The RBA made some worried noises about the housing market, probably reflecting the assessment that’s likely to show up in Friday’s semi-annual Financial Stability Review. “Given the environment of rising housing prices and low interest rates, the bank will be monitoring trends in housing borrowing carefully,” the RBA statement said. “It is important that lending standards are maintained.” That sounds to me like they’re more likely to lean on the banks to maintain discipline than to raise rates to dampen an overly speculative housing market. That could be slightly negative for AUD in that it reduces the likelihood of a rise in rates to deal with the issue. Something similar happened recently in New Zealand when the government made several changes in regulations in order to dampen speculation in the frenzied housing market there. This quelled speculation about a rise in rates and sent NZD lower.
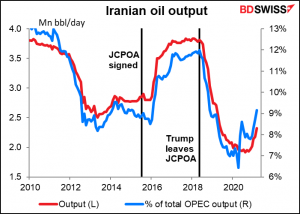
Getting back to CAD…it may well continue to recover today as oil prices are rebounding. The recovery has been variously ascribed to Britain’s warning that it may continue limiting foreign travel, which dampened hopes for a recovery in travel this summer, to less concern about reviving the Iranian nuclear deal. Indirect talks between the US and Iran on the Joint Comprehensive Plan of Action (JCPOA) begin in Vienna today, with senior officials of the six countries remaining in the deal — Britain, France, Germany, Russia, China and Iran — meeting. The US and Iran won’t meet directly, but rather the Europeans will serve as go-betweens. As the possibility of a breakthrough in the talks fade, the likelihood of a pick-up in exports from Iran fades too, removing one risk from the oil market.
Today’s market
Note: The table above is updated before publication with the latest consensus forecasts. However, the text & charts are prepared ahead of time. Therefore, there can be discrepancies between the forecasts given in the table above and in the text & charts.
Really, really not much on the schedule for today.
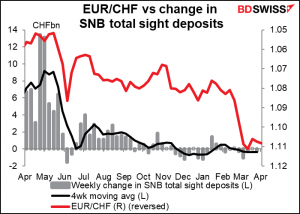
Should I keep following the Swiss sight deposits every week? I guess I have to, just to see if the Swiss National Bank (SNB) ever does start intervening again. Deposits are down CHF 1.3bn from end-December and down CHF 5.2bn from their peak the week of Nov. 13th, which suggests that the SNB has been taking the opportunity of the strong EUR (or weak CHF) to reduce its reserves a bit.
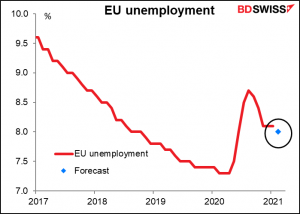
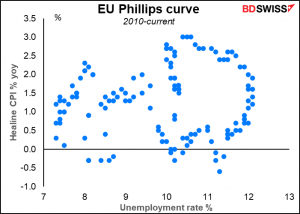
After that comes EU unemployment, which is expected to tick down to 8.0% after three months at 8.1%. But since the ECB doesn’t have a dual mandate and focuses entirely on inflation, unemployment isn’t as big an issue for the Eurozone as it is for many other countries.
Of course, unemployment may be related to the inflation rate – a relationship known as the Phillips curve — but in the EU that relationship is rather tenuous. There might have been some connection before the Global Financial Crisis…
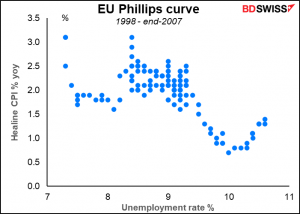
…but there doesn’t seem to be any since then.
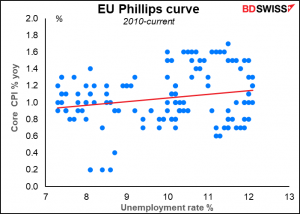
In fact, for core inflation, which is what the ECB supposedly targets, the relationship nowadays seems to be backward if anything – that is, lower inflation seems to go along with lower unemployment (although the relationship is quite weak).
The IMF/World Bank Spring Meeting is in full swing today. Since the meetings are being held virtually you can watch some of the proceedings if you want on IMF Live or World Bank Live. You can see the whole schedule.
The IMF will release its new World Economic Outlook today. That sometimes causes a “risk-on” or “risk-off” flurry, depending on whether they upgrade or downgrade their forecasts. This time I’d expect an upgrade, which could be positive for AUD.
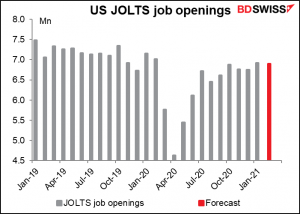
Which brings us to the Job Openings and Labor Turnover Survey, or JOLTS report. Although the Bloomberg relevance score suggests that this is not a big market-mover, it is important as an indication of the health of the job market. Unfortunately, it’s expected to be not so healthy; the number of openings is forecast to decline by 17k from the previous month. That would leave them 2.6% below the pre-pandemic level.
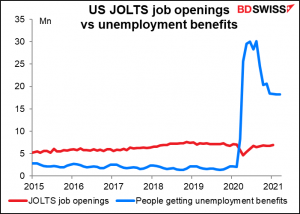
Despite the surge in jobs shown in last Friday’s nonfarm payrolls, there’s still a lot of unemployed persons. The number of people getting unemployment benefits only fell by 5k in March, which is tiny considering that the number is a little above 18.2mn. So, we can see that despite the improvement, there’s still a long way to go before we’re back to where we used to be – more jobs than people getting benefits.
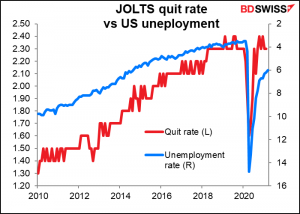
We should also watch the quit rate, the percentage of people who voluntarily quit their job during the month. That equaled the record high of 2.4% back in October and December (data back to Dec 2000) and was still quite high at 2.3% in January. The quit rate indicates people’s confidence that they can get another job – generally speaking, people don’t quit their jobs unless they have another one lined up or think they can get one easily. The historically high quit rate suggests that for some people, maybe the job market isn’t as bad as the unemployment rate would suggest.
Source: BDSwiss