Rates as of 05:00 GMT
Market Recap
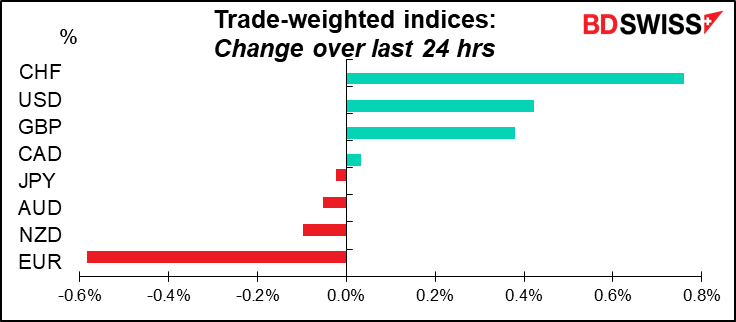
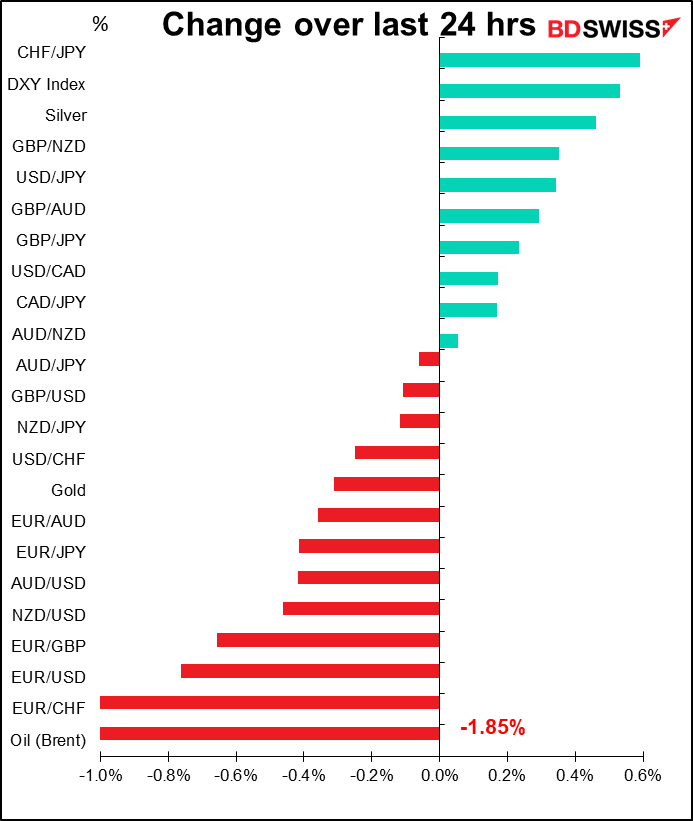
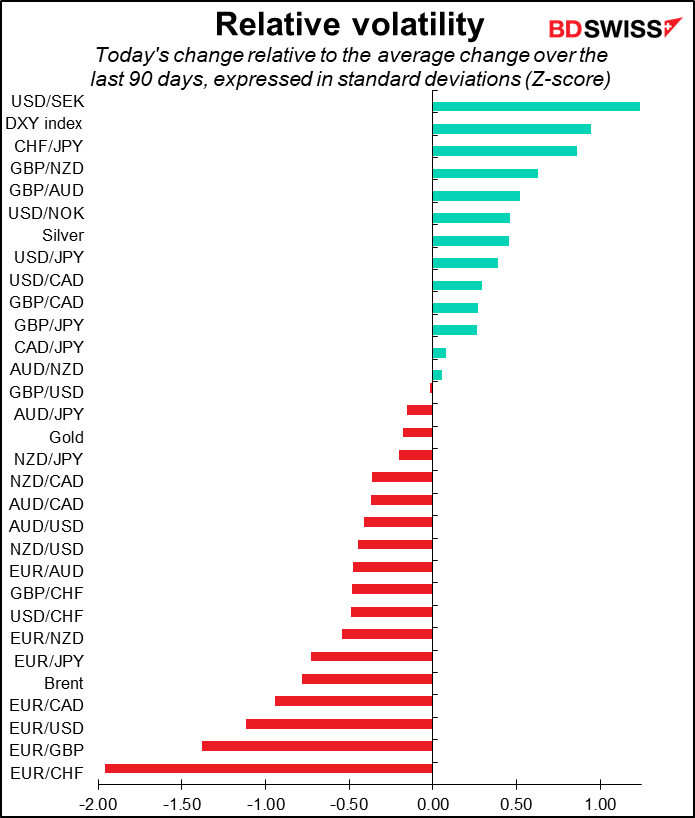
It’s gas, gas, gas today! EUR was the focus as natural gas prices rose 21% to hit their highest level in more than four months, leading to broad-based EUR selling. EUR/CHF was the main feature – it had a 2-standard-deviation day.
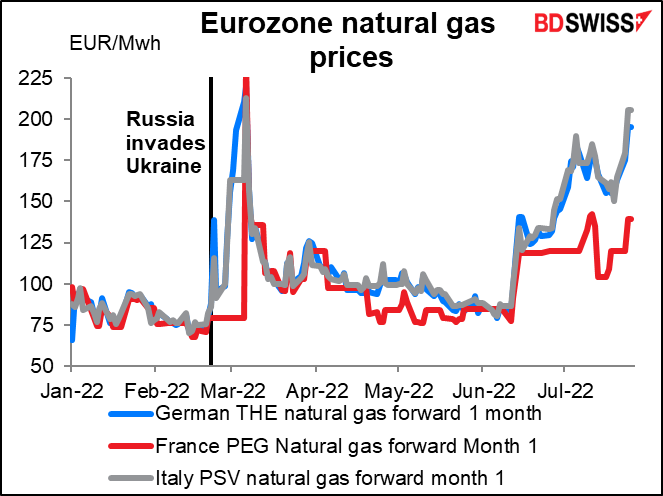
On a conference call, Russian officials said another turbine from the Nord Stream 1 pipeline has “problems,” and will need maintenance. That would reduce the flow of gas to a level that would require rationing. This bad news came along with a Bloomberg story saying that Russia “is likely to keep vital gas flows to Europe at minimal levels as long as the standoff over Ukraine continues.”
Meanwhile, EU energy ministers agreed to cut their gas usage by 15% (with the potential for the reduction target to be made mandatory if flows from Russia are severely curtailed). The deal isn’t as restrictive as had been hoped because in order to reach an EU-wide agreement, the ministers had to agree to allow member states a lot of flexibility to determine demand curbs.
Adding to the negative sentiment, Lufthansa canceled most flights from its Frankfurt and Munich hubs due to a strike. This news wasn’t particularly related to the gas problem but it was just more bad news for Europe.
My question is, why are people selling EUR/CHF because of Europe’s natural gas problems? Where do they think Switzerland is located? According to the Swiss government:
Natural gas meets about 15 per cent of Switzerland’s energy requirements. In this country, it is mainly used for heating and cooking – around 30,000 homes are heated with gas – as well as in industry. Compared with many other European countries, Switzerland uses very little gas.
Switzerland has neither its own natural gas reserves nor large domestic storage capacities, so all the natural gas it uses must be imported. Swiss gas companies purchase natural gas on trading platforms in neighbouring EU countries. Switzerland imports about half of all its natural gas from Russia. As a major transit country in the heart of Europe, it is very well integrated into the European natural gas transport network. The transit pipeline between Germany and Italy can be used in either direction. Switzerland also has a widespread domestic transport network. (emphasis added)
There are two points here: 1) Switzerland will be affected by any cutoff of Russian gas just like every other European country, and 2) it’s likely to be affected less. For example, gas supplies 26.7% of Germany’s total energy needs, much of which goes to industry – something like 12% of the country’s electricity is generated from gas, not to mention the steel industry too.
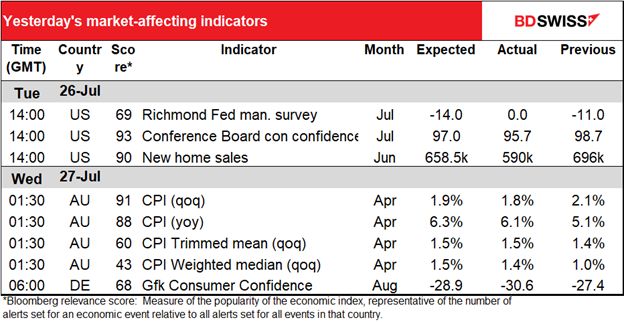
Elsewhere, AUD came off after the consumer price index (CPI) missed expectations. I think fears of lower growth may weigh on AUD for some time. The International Monetary Fund (IMF) yesterday said the world “is facing an increasingly gloomy and uncertain outlook.” It forecast that growth would slow from 6.1% last year (an abnormally high figure due to the rebound from the pandemic) to 3.2% this year and 2.9% next year, “downgrades of 0.4 and 0.7 percentage points from April. This reflects stalling growth in the world’s three largest economies—the United States, China and the euro area—with important consequences for the global outlook.”
Today’s market
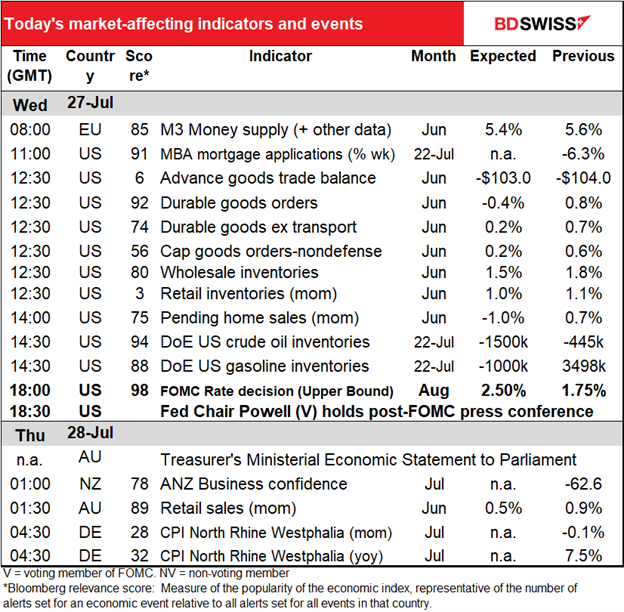
Note: The table above is updated before publication with the latest consensus forecasts. However, the text & charts are prepared ahead of time. Therefore there can be discrepancies between the forecasts given in the table above and in the text & charts.
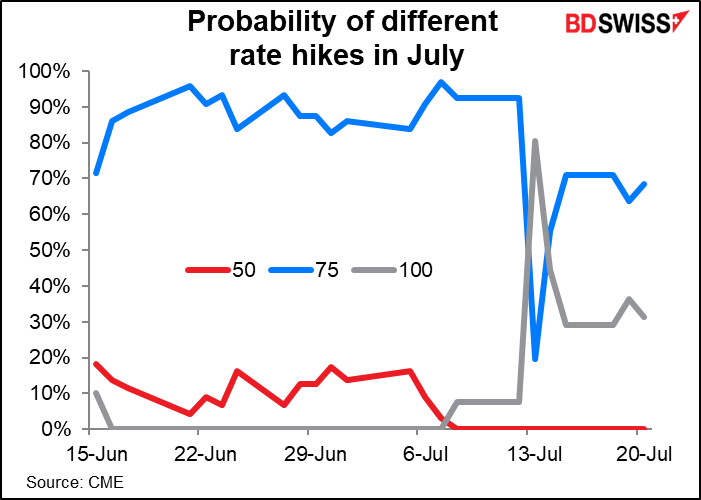
OK boys and girls, it’s FOMC day today! The Federal Open Market Committee (FOMC), the body that sets interest rates for the US central bank, meets today. Its decision is guaranteed to rock the financial world. I already wrote about this in depth and detail in my Weekly Outlook: 75 or 100?, which sums up the question: will they hike rates by 75 bps or 100 bps?
For a brief period everyone was convinced they’d hike by 100 bps, but right before the blackout period began, several Committee members poured cold water on that idea. (FOMC members aren’t allowed to comment on monetary policy from the second Saturday before the FOMC meeting until the Friday after the meeting.) The market now expects a 75 bps hike.
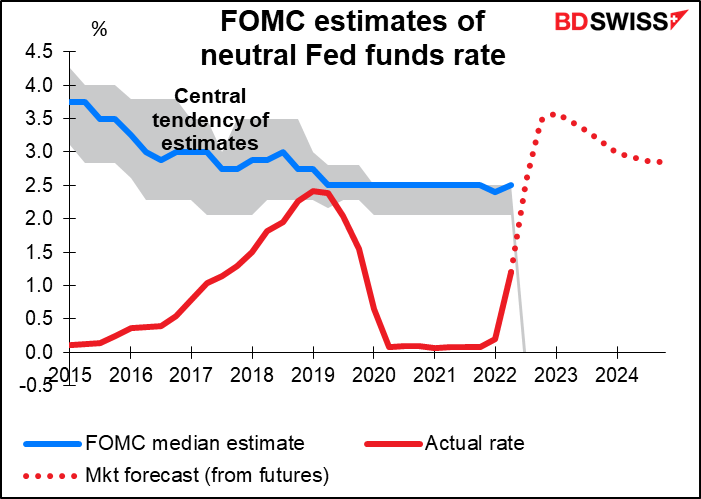
That would bring the rate to 2.375%, pretty near what the median Committee member considers to be the longer-run neutral level for this key rate. “Neutral” being the rate at which it neither stimulates the economy nor holds it back.
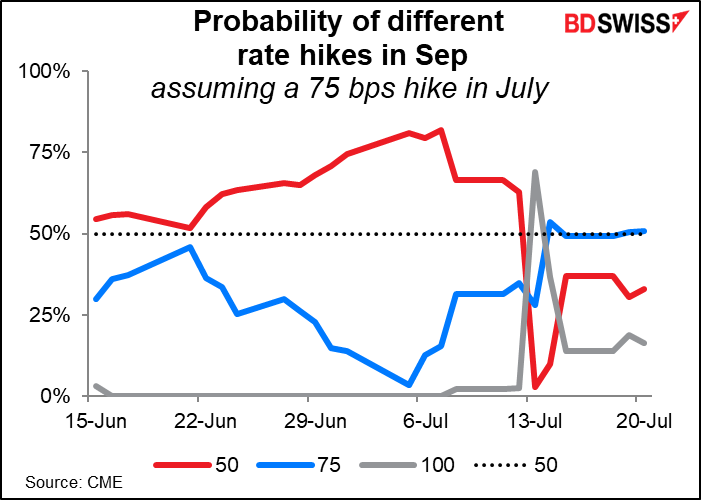
The big question after that is of course what guidance will they give about September and beyond? For the last several meetings they’ve said that the Committee “anticipates that ongoing increases in the target range will be appropriate.” I would expect that line to remain in the statement and for the question to come up in Fed Chair Powell’s press conference. He’s likely to reiterate the guidance similar to what he said back in June about the July meeting, namely that the Committee will probably decide between a 50 bps hike and 75 bps. Since there is no meeting in August, they’ll have two more CPI prints to mull over when they meet on Sep. 21st.
The market currently has no strong view on September. It sees another 75 bps hike as a 50-50 proposition, with more likelihood (33%) of a 50 bps hike than a 100 bps hike (16%).
That would bring the fed funds rate clearly into restrictive territory. This is likely to be one major focus at the press conference: what forward guidance Fed Chair Powell can give about how far above the neutral rate they are willing to take rates. The futures market sees the fed funds rate peaking at 3.45% in January & February of next year. What does Chair Powell think the terminal rate will be?
The other point that journalists will no doubt quiz the Chair on is, what’s the likelihood that they can manage to bring inflation down to their target level without causing a recession? Of course no Fed Chair would admit that they are planning to cause a recession, but Powell will probably repeat his usual comments that reducing inflation is likely to require some pain and there’s a relatively narrow landing strip here, although they can take some comfort from the fact that the S&P Global US purchasing managers’ indices (PMIs) are still in expansionary territory (although the regional Fed’s versions aren’t).
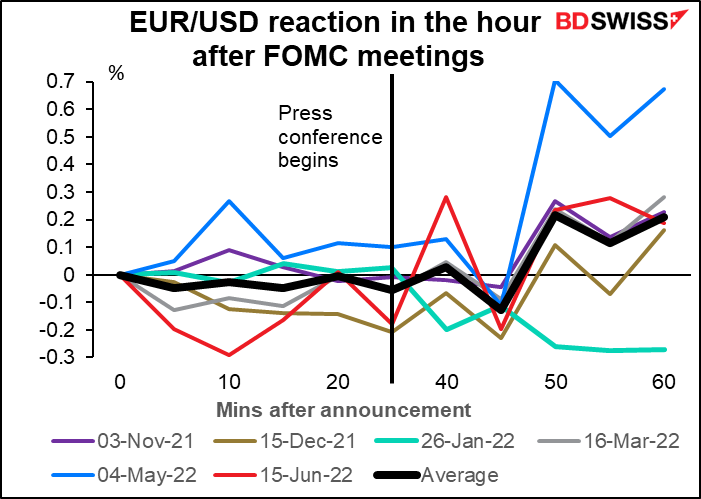
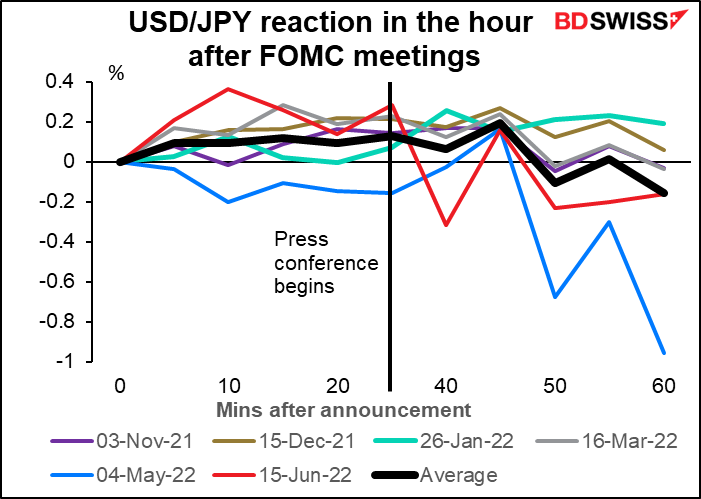
How does the dollar tend to trade after the FOMC meeting? Over the last six meetings, the dollar has tended to weaken slightly after the FOMC statement is released. The big moves though don’t come until the journalists start questioning Fed Chair Powell. About 10 minutes into the press conference – after he’s made his initial statement and the questions begin – is when the action really starts. Again, in general the dollar has weakened, although past performance is no guarantee of future performance.
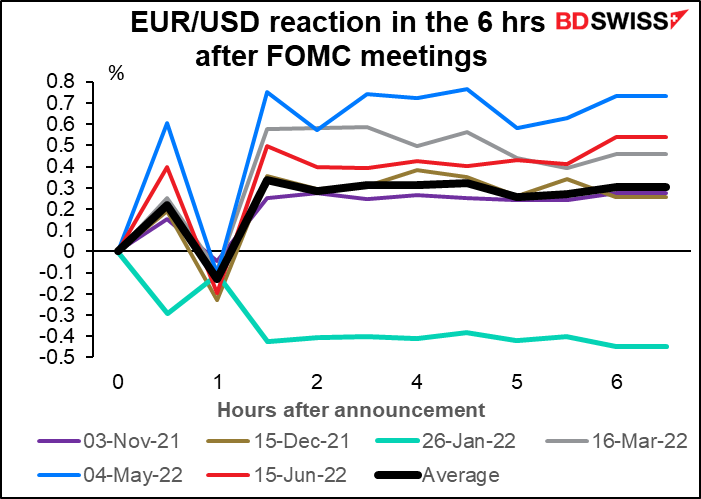
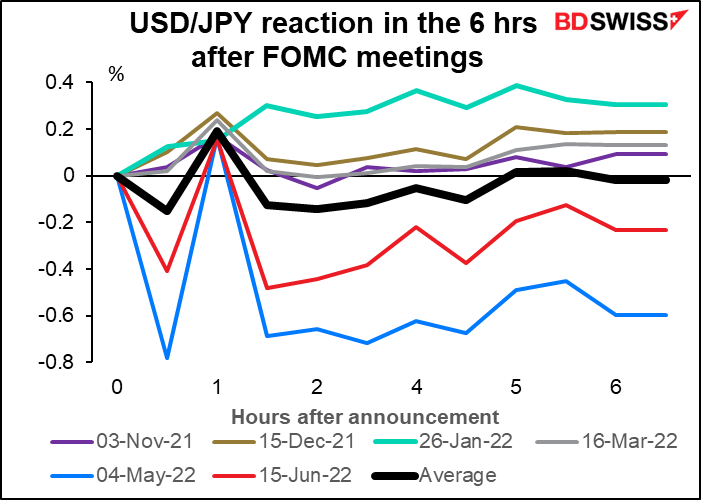
The weaker dollar trend tends to last for the next several hours as well.
That would be enough excitement for one day, but in addition there are several important indicators coming out.
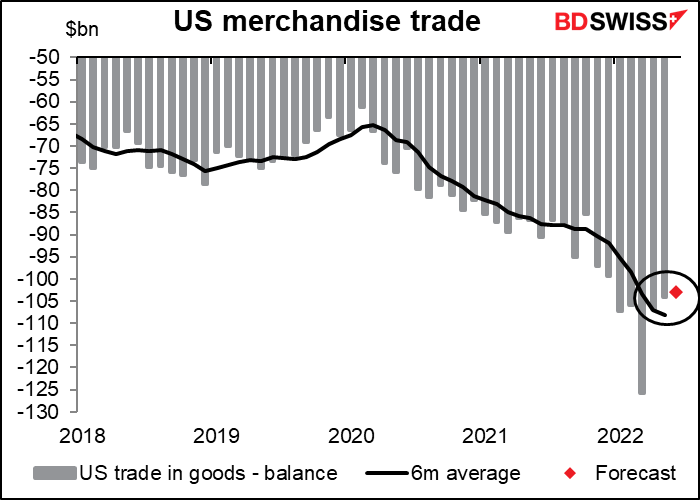
Nobody cares too much nowadays about the US merchandise trade balance, aka the US advance trade balance (in that the trade in goods comes out in advance of the figure for trade in goods & services combined). The deficit is expected to narrow slightly but I don’t think we’ll see much reaction in the market to this (although the data do feed into the GDP calculation).
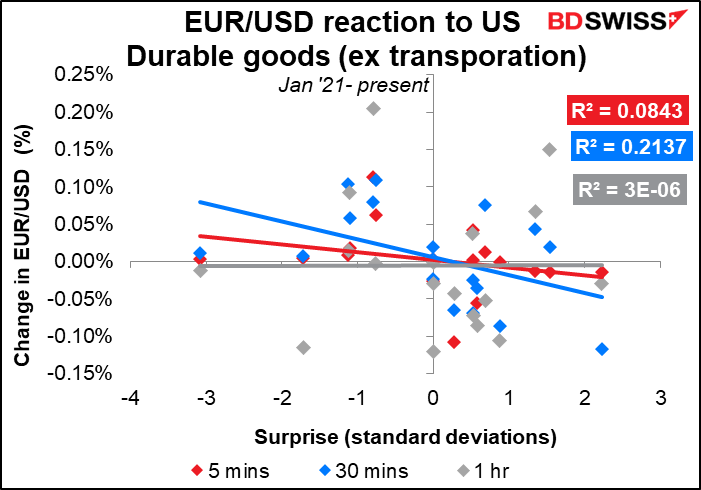
The US durable goods figure is more closely watched. It’s expected to be down slightly after three consecutive months of increase.
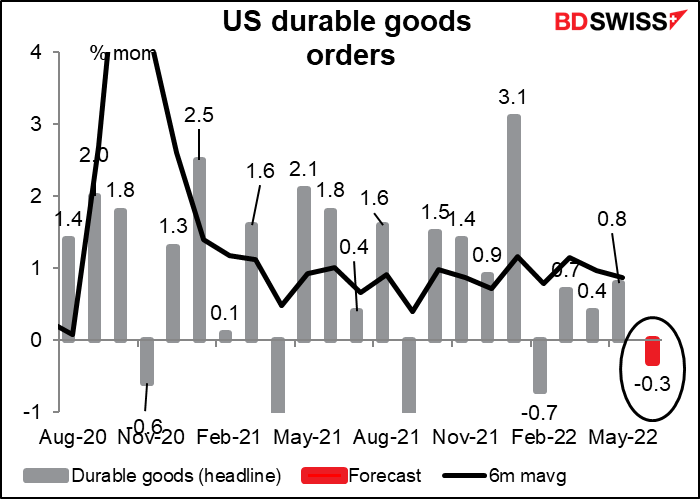
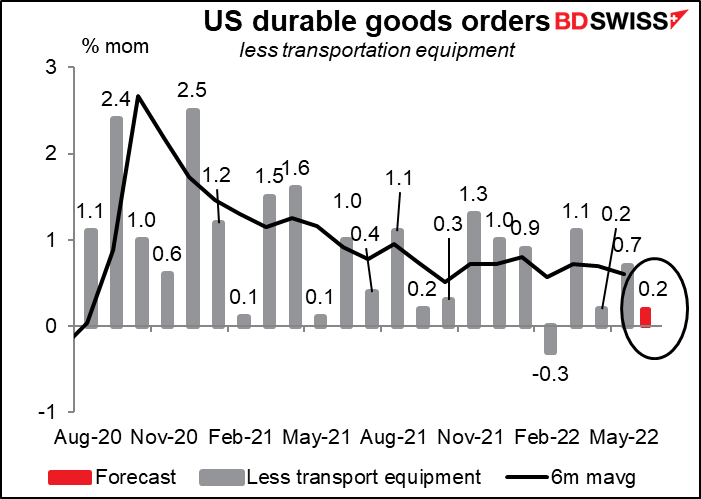
However the cause of the decline seems to be concentrated in the transportation sector. Excluding transportation, durable goods are forecast to be slightly higher.
Which should you be looking at to trade? Neither has a particularly good correlation with the subsequent movement of the FX market.
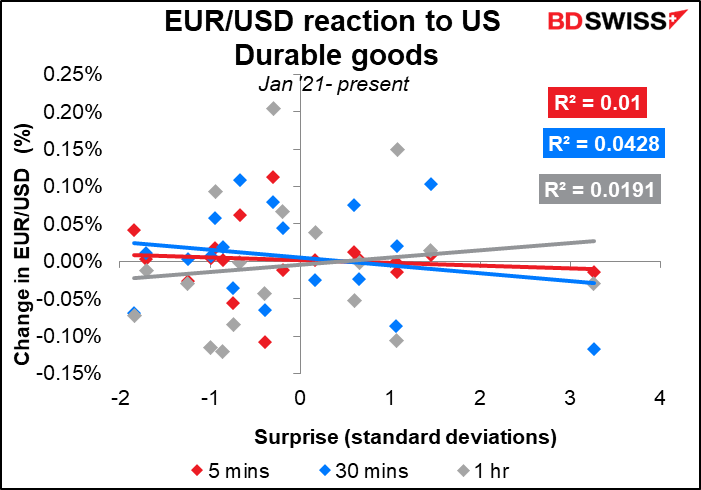
The 30-minute response here is pretty good, but it’s not mirrored in USD/JPY so I question how real it is.
Wholesale and retail inventories are both expected to rise, particularly retail inventories.

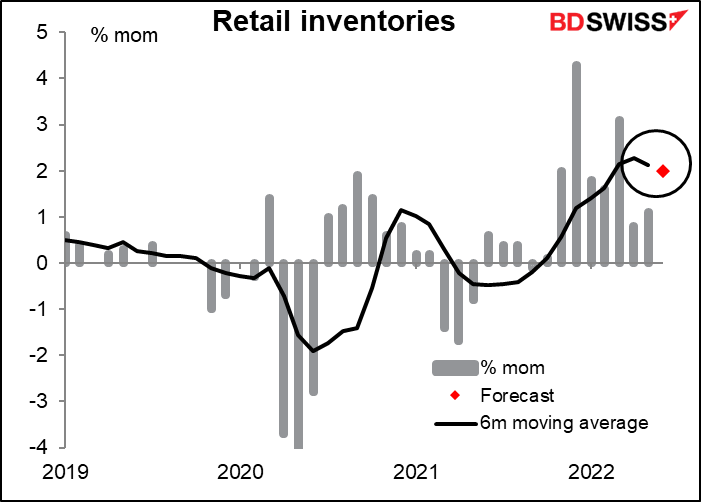
I don’t usually cover the inventory data because normally it isn’t of interest to the FX market. But recently I’ve been seeing a lot of articles on how retailers are stuck with excessive inventories – inventories up 40% or more from a year ago – and are having to slash their buying and put on sales to get inventories down. A further rise in inventories could be good news for inflation further down the line – it might presage big sales.
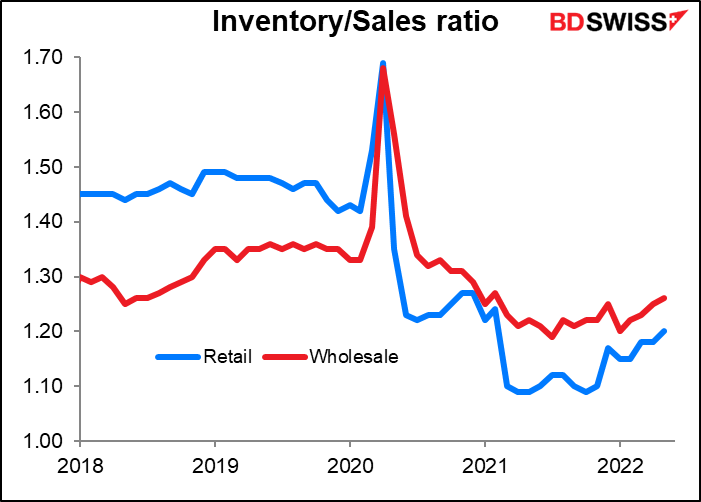
Oddly enough though I don’t see it in the data – at all. The inventory/sales ratios at both the wholesale and retail levels are well below the pre-pandemic level. I’ll still be watching this data though as it may be the key to solving the inflation problem.
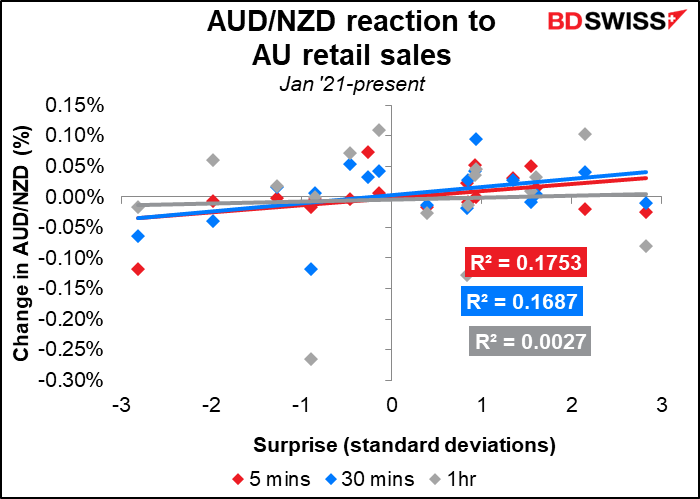
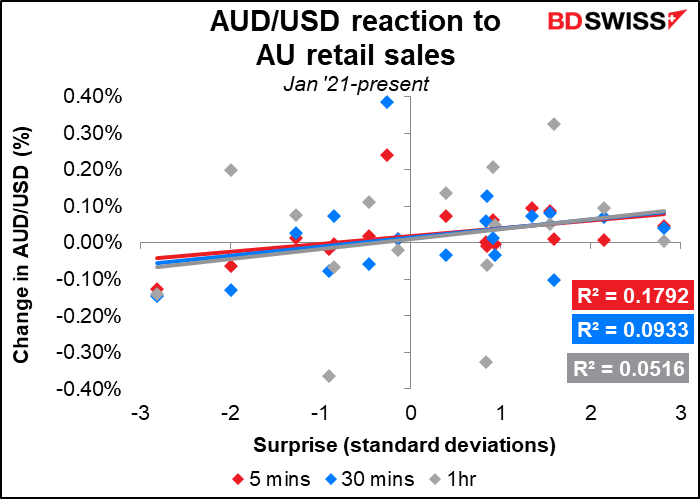
Overnight, Australia releases its retail sales. Post-COVID reopening and normalizing spending and saving patterns still seem to be pushing up sales. Sales momentum may have slowed in June however due to rate hikes, slumping consumer confidence, and a rotation in spending away from retail to non-retail sales (such as travel). Nonetheless another gain should convince people that demand remains robust, which could be positive for AUD.
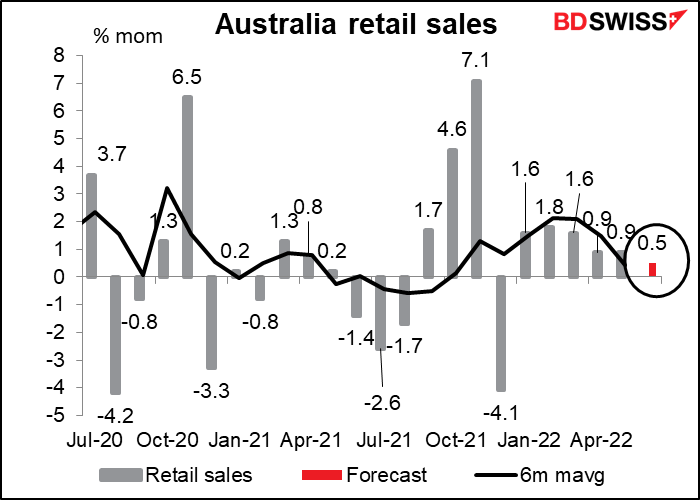
If you’re thinking of trading the figures, the response in AUD/NZD is marginally more consistent than in AUD/USD.
Source: BDSwiss