Rates as of 05:00 GMT
Market Recap
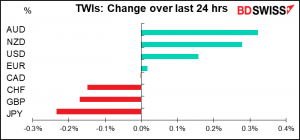
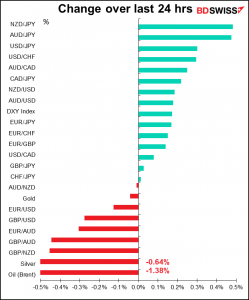
The commodity currencies did well yesterday. That didn’t have anything to do with the data that I could see — Australia Q2 GDP this morning far exceeded expectations ( 0.7% qoq vs 0.4% qoq expected) but that barely registered a 10-tic blip. The move came entirely during early trading yesterday (AUD/USD peaked at 06:26 GMT).
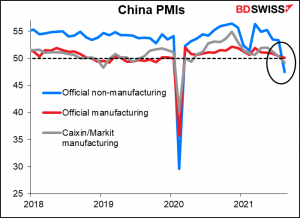
Nonetheless the fact that AUD and NZD are still up on a trade-weighted basis from yesterday morning when I ran my spreadsheet is pretty impressive, given the disappointing figures we’ve had out from China. This morning’s Caixin China manufacturing purchasing managers’ index (PMI) was 49.2 (50.1 expected), below the 50 “boom-or-bust” line that signals the difference between expansion and contraction. So on this measure, China manufacturing has begun contracting (the official manufacturing PMI, which covers more of the large state-owned companies, remained just barely above the line at 50.1). Meanwhile last week’s official service sector PMI was also in contractionary territory (47.5, down from 53.3). This is extremely rare; since the data series started in 2007, it’s only been below 50 once before, last February, when officials were welding doors shut to keep people inside. The resilience of the commodity currencies in the face of signs of Chinese weakness suggests that they may have found a base for now.
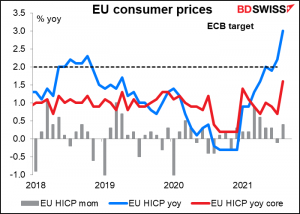
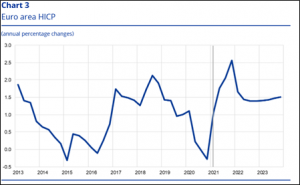
Meanwhile, EUR got a boost vs its European neighbors – but not USD – after EU-wide inflation came in much higher than expected ( 3.0% yoy vs 2.7% expected, 2.2% previous – core 1.6% yoy vs 1.5% expected, 0.7% previous). That’s the highest headline figure since Nov. 2011 (highest core since July 2012) and above every forecast on Bloomberg.
Two members of the European Central Bank (ECB) Governing Council, Holzmann (Austria) and Knot (Netherlands) both suggested that the inflation outlook had improved enough to justify a reduction in ECB stimulus. Holzmann said he was in favor of reducing the pace of emergency bond purchases in Q4 “and more so” in Q1 next year, while Knot wants an immediate slowdown in ECB purchases, an end to the EUR1.8tn Pandemic Emergency Purchase Program (PEPP) in March, and a return to pre-crisis discipline, whatever that is. (Officially, the ECB said it will terminate the PEPP “once it judges that the COVID-19 crisis phase is over, but in any case not before the end of March 2022.”)
Such hawkish comments suggest that next Thursday’s ECB meeting, which will include updated ECB staff economic forecasts, is shaping up to be a controversial one. Headline inflation may have hit 3.0% for now, but the new ECB monetary policy strategy statement says that they are aiming for 2% inflation “in the medium term.” Since it’s been below 2% from November 2018 until June 2021 (31 months), does that mean they have to let it run above 2% for 31 months? What will the new staff forecasts say about the medium-term outlook? The current projections are that headline inflation rises significantly this year to a peak of 2.6% in Q4 (already surpassed!) but that it falls back after that, averaging a below-target 1.5% in 2022 and 1.4% in 2023. If those forecasts aren’t revised up significantly, there could be a big battle between the short-term hawks and the longer-term doves.
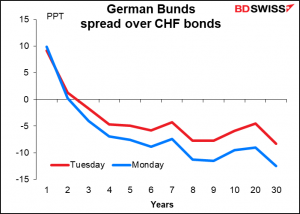
Talk of reducing or ending the bond purchases sent yields of Eurozone bonds higher. That increased the attractiveness (or reduced the unattractiveness, whichever way you want to look at it) of German bonds vs CHF bonds, which helped to push up EUR/CHF.
Today’s market
Note: The table above is updated before publication with the latest consensus forecasts. However, the text & charts are prepared ahead of time. Therefore there can be discrepancies between the forecasts given in the table above and in the text & charts.
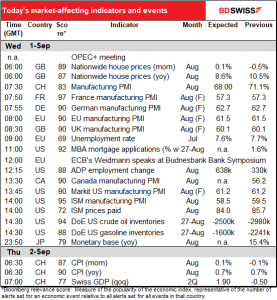
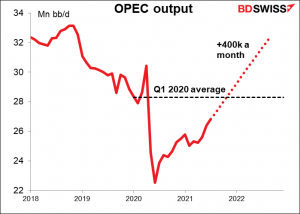
The Organization of the Petroleum Exporting Countries (OPEC) and allies including Russia, collectively known as OPEC , meet today to discuss the previously agreed increase of 400k barrels a day (b/d) every month until Sep. 2022. At that pace, they’ll get back to the pre-pandemic level of output by November and over 32mn b/d by Sep. 2022. The market is expecting the group to approve the pre-arranged increases and so it would have no impact on prices. Only a decision to reduce or delay the increase would have any significant effect on oil prices.
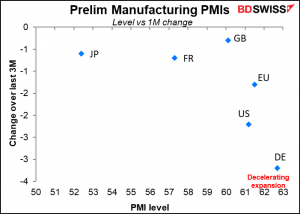
The day will be dominated by the manufacturing purchasing managers’ indices (PMIs), including the final versions for those major industrial countries that have preliminary ones. Usually they aren’t revised very much, but revisions can be market-affecting. The preliminary versions for the major industrial countries all fell from the previous month but still showed continued strong expansion, except for Japan.
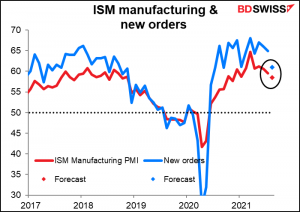
Of course, all eyes will be on the Institute of Supply Management (ISM) manufacturing PMI, despite the fact that it’s not as accurate a reflection of US manufacturing industry as the Markit version is. But at least they supply all the data on Bloomberg, whereas Markit makes only the headline figures available, and even that’s just for the last three years. Nor will they sell me a one-off dump of the back data. I’d have to get a full subscription for a year, which costs around $30k. Remembering Jack Nicholson’s famous toast scene from “Five Easy Pieces,” I asked if I could get a one-day subscription, but they scoffed at me.
The overall index is expected to decline (-1.0 point), while new orders are forecast to decline even more (-3.9 points). Although the expected level for new orders of 61.0 is still quite high, nonetheless there could be some concern about a loss of momentum if it does fall that much.
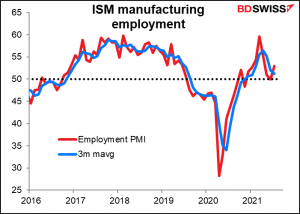
In addition to the overall index, people will be watching the employment PMI. While it’s not very good at forecasting the monthly changes in nonfarm payrolls, it is somewhat reliable at capturing the broader trends in hiring. The 3-month moving average has begun to turn down sharply, from 56.4 in April to 51.2 in July. That augurs poorly for employment gains in the future. (The service sector version of this indicator is even more important, as service sector employment is a bigger part of total employment and furthermore was hit harder by the pandemic).
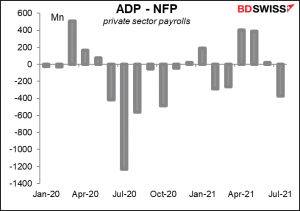
Of course if we’re talking about employment, then even more attention today will be on the ADP employment report. Automated Data Processing Inc. (ADP) is an outsourcing company that handles about one-fifth of the private payrolls in the US, so its client base is a pretty sizeable sample of the US labor market as a whole. It’s therefore watched closely to get an idea of what Friday’s US nonfarm payrolls (NFP) figure might be.
One point to note: the ADP adjusts its figures to match the final estimate of the NFP’s reading on private payrolls. It is therefore two steps removed from the headline figure that everyone focuses on, which is the initial figure for total payrolls, including government workers. So while it’s one of the best guides to the NFP that we have, it’s not perfect by any means – in fact, neither is the NFP figure itself, since it’s always revised.
The forecast this month is for the ADP report to be up 638k jobs, vs a forecast rise in private payrolls of 652k (and 748k for nonfarm payrolls total).
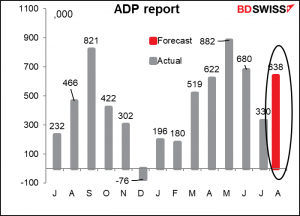
Note though that there have been some big misses this year, ranging from the ADP being 403k over the NFP in April to 373k below last month. That’s 185% above to 53% below. So don’t get too excited about the figure.
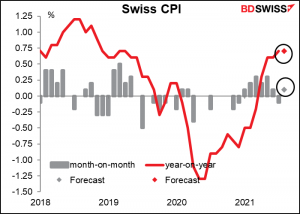
Then early tomorrow morning we get Swiss consumer prices and Swiss GDP. It’s notable that the Bloomberg relevance score for the CPI is significantly higher than that for the GDP (90 vs 77) – quite unusual. (For the US it’s vs 96 vs 97 respectively, for the UK it’s 96 vs 98, while in Germany it’s vs 89 vs 80, but then again Germany isn’t the only country in the Eurozone.) I assume it’s because the Swiss National Bank is focused entirely on inflation, and also because the major Swiss companies aren’t dependent on the small domestic market, hence domestic growth doesn’t matter that much for stocks.
In any case, I’m not sure it matters for us because a) no big change is forecast and b) I’m not sure CHF moves on domestic macro news anyway – with the SNB on hold since 2015, it’s mostly a function of global risk appetite.
Source: BDSwiss