Rates as of 06:00 GMT
Market Recap
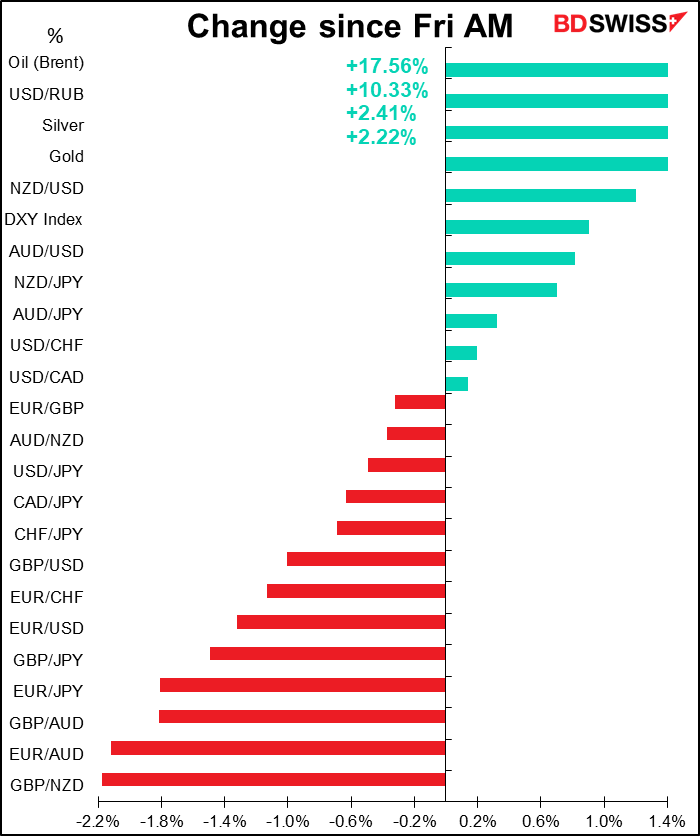
All the focus is on the oil market this morning. Oil shot up as much as 18% in early trading on reports that the US is discussing a ban on Russian crude oil imports. I’m not sure what difference it makes – as far as I can tell, Russian crude isn’t trading anyway – but it shocked the market nonetheless.
This morning when I ran my spreadsheet, Brent was $130.09/bbl, up 17.6% from Friday morning. You may remember that the record closing price for Brent was $146.08 on July 3, 2008. We’re not far off that level now (although that’s not adjusted for inflation over that period – adjusted for inflation it would probably be over $200 now).
There is talk that Iran might be allowed to sell oil again – apparently the Biden Administration will do whatever it can to keep oil prices from rising too far – but Russia is demanding a role in those talks, which may be hard to arrange. At the same time Libya said two of its main oil fields have shut down, cutting 330k barrels a day out of the world’s supply.
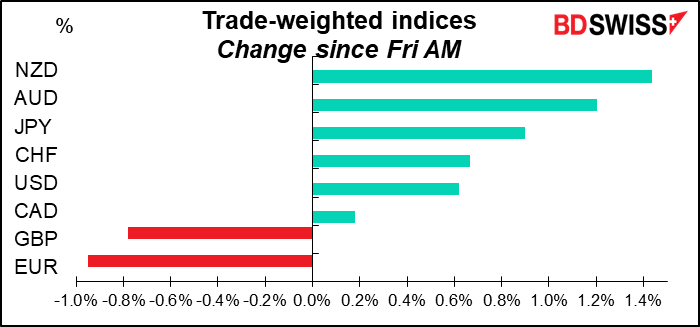
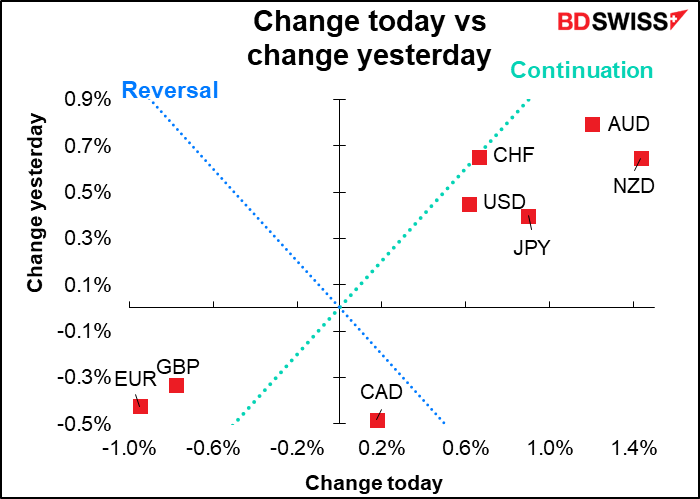
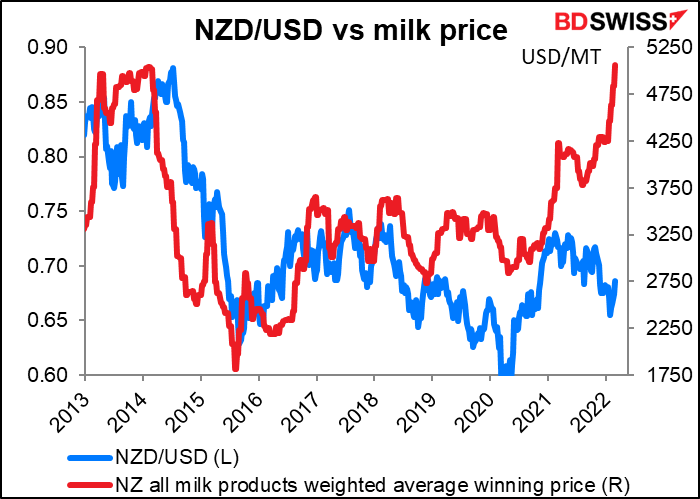
Stock markets are generally lower – Japan’s Nikkei is down 2.9%, Hong Kong’s Hang Seng index -3.9%, the China CSI 300 -3.2%. So it’s significant that the commodity currencies are outpacing the safe-haven currencies. It looks like investors think that the increase in the price of commodities will finally outweigh the decrease in the volume of sales due to slower economic activity. Everyone is focused on grain prices thanks to Russia and Ukraine, which account for some 29% of global wheat exports (wheat is 74% YTD so far) but milk, the main export of New Zealand, is up 22% YTD in the US. The close correlation that held between NZD/USD and milk prices up until 2019 has fallen apart.
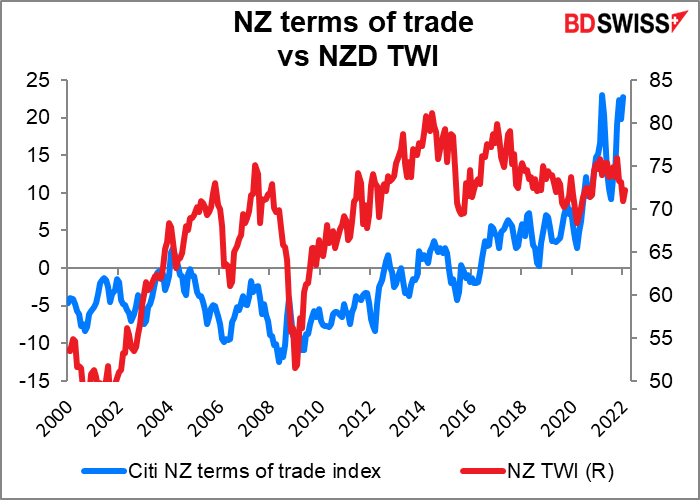
But at some point the higher milk prices are bound to exert a pull on NZD/USD through improving terms of trade, which haven’t been affecting the currency in the way that textbooks say they should (perhaps because financial flows dominate over trade flows nowadays).
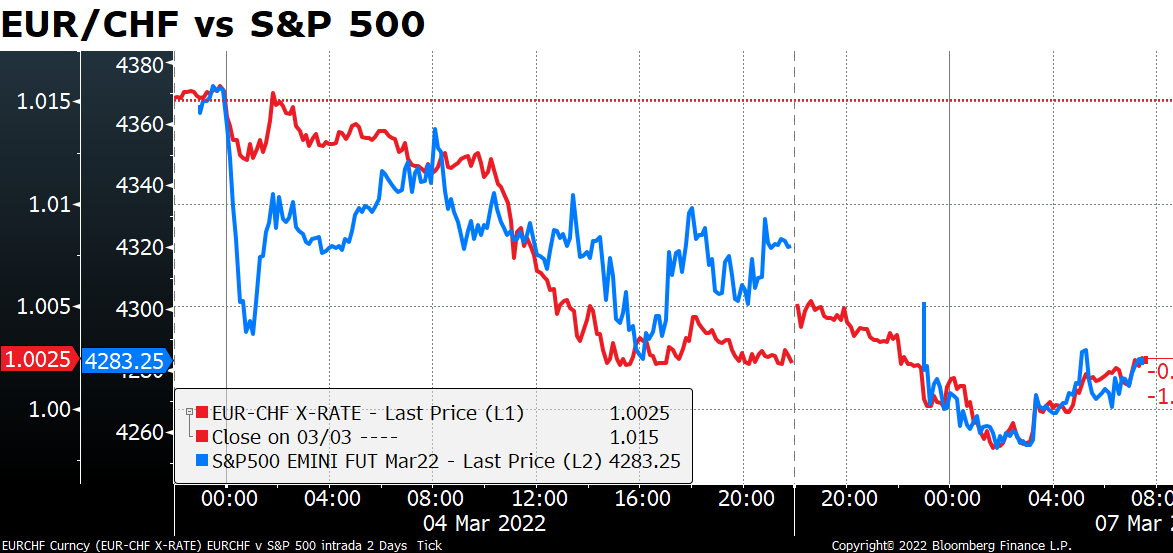
The other feature is the weakness of EUR, naturally, as the crisis in Ukraine will have the most impact on Europe. EUR/CHF briefly fell through parity this morning. I can’t see this trend ending as long as the fighting goes on.
Friday’s US employment data
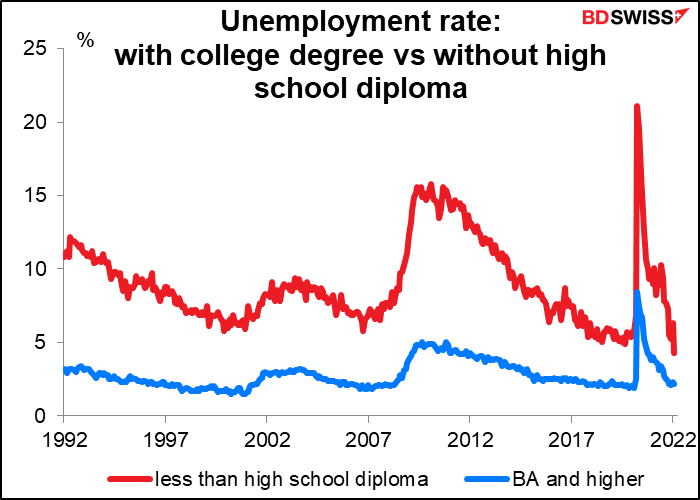
Ordinarily I’d be writing pages & pages about Friday’s better-than-expected US nonfarm payrolls ( 678k vs 467k expected, unemployment 3.8% vs 3.9% expected, participation rate up, average weekly hours up), but I’ve written so much about other things, I’ll just make this one point. With data going back for 30 years, we’ve reached the lowest unemployment rate on record for those without a high-school diploma. Also the difference between those people and those with a college B.A. or higher is the narrowest it’s ever been. This is a great example of the “broad and inclusive” recovery in employment that the Fed wanted to see.
Now on to Thursday’s US consumer price index to see if inflation is still running away (the market says yes – the consensus prediction is for a stunning 7.9% yoy). That may get people penciling back in rate hikes that they might’ve erased because of the fighting. The dollar could get a boost as a result.
Some words about Russia/Ukraine
I spent a lot of time this weekend reading about the Ukraine invasion (as well as going to a nice vegan restaurant for lunch – but that’s another story.) Here’s what I learned:
A senior US defense official suggests Russia is stalled. He said they’ve seen “limited changes on the ground over the past day.” “There does not appear to be any significant movement along the Russian axes.” The Russians have committed “somewhere near 95% of the combat power they had amassed along the border.” In other words, Russia has thrown everything they have into the fight but they’re stalled in the face of “strong Ukranian resistance.”
Logistics are the Achille’s Heel of the Russian army. The Russian army uses trains to move materiel domestically. Once they get outside their own borders they simply don’t have enough trucks to carry all the stuff the army needs to move forward and to hold territory. Estimates are that they start to struggle once the fighting is 145 km from the end of the railroad. Kyiv is some 360 km from the border.
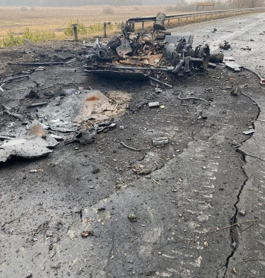
The Ukrainians know this and are attacking fuel trucks and other supply trucks. Tanks run out of gasoline and can’t move. Soldiers don’t get fed and revolt. “An army travels on its stomach” as Napolean said. Today it’s no different except now they need gasoline too. You can see videos on Twitter of Russia moving commercial vehicles, pick-up trucks, white delivery vans etc on trains toward Ukraine. They’re going to be transporting rockets in pizza delivery trucks.
One key point: Russia didn’t prepare any materials to repair roads. Their tanks have destroyed the roads but they have no way to fix them. The pizza delivery trucks they’re bringing in will be less than useless anyway.
As for the food…there are reports of soldiers getting food that’s seven years past its sell-by date The soldiers have to loot local stores to get food. That’s bad for morale.
US General Norman Schwarzkopf once said, “Captains think tactics, general think trucks.”
I recommend the following video: https://www.youtube.com/watch?v=b4wRdoWpw0w and/or the following tweet “on why we are almost certainly overestimating the amount of strength the Russian Army has on hand, and the amount they can actually get to Ukraine when their first force losses get so high that it starts becoming combat ineffective. Yes, it’s logistics.” https://twitter.com/PhillipsPOBrien/status/1500213943012319252
You can see a video of Russian trains carrying commercial vehicles to Ukraine here https://twitter.com/visegrad24/status/1500431799574478848?s=20&t=R_uT2rc-mc7T1ywtUeejgA
Russian victory is impossible. Nuclear war is unlikely. There is an interesting analysis of the situation by someone who is allegedly a member of Russia’s Federal Security Service (FSB), the successor agency to the KGB. He says “By and large, the country has no way out. It’s just that there is no option for a possible victory, and defeat is everything…” He attributes the disaster to a lack of transparency – no one knew what was coming, so no one could prepare – and the need for bureaucrats to deliver only good news to their higher-ups.
He is optimistic on one point: he argues that one person can’t launch the nuclear weapons, and even if he could, is there any evidence that they would work any better than the trucks Russia has sent to Ukraine? https://pastebin.com/2agMRGmd
A University of Toronto professor explains why the sanctions won’t topple President Putin, but will make it impossible for him to defeat Ukraine. https://twitter.com/olga_chyzh/status/1500257111770550273
She argues that the oligarchs that the sanctions are targeting need Putin more than he needs them. They have money because they manage state assets. If Putin goes, then their access to these assets disappears. Putin also has some old friends from the KGB, the ‘strongmen.” These people are hostile to the West and see Russia’s isolation as a good thing. “The bottom line: The current sanctions decrease the size of the pie, but the pie is still very large and Putin’s ability to distribute it is intact. No other candidate would guarantee a similar distribution to the current players. And selecting a new candidate is a coordination problem of its own. Hence, the probability of a regime change is low.”
The sanctions aren’t pointless, however. “What the sanctions DO achieve is the rapid weakening of the Russia’s economy, and with that, its military capacity. It is a matter of weeks before the state can no longer pay its employees—doctors, teachers, administrator, but also the police, the military-industrial complex, and the military itself. No new tanks, destroyers, or howitzers, and no soldiers to shoot them either.”
For more information on the impact on the military, watch this stunning video of a captured Russian soldier. He relates how he was told that Ukraine is being occupied by Nazis and they were going in to liberate the common people. “We did not know the situation…We brought sorrow to this land.” https://twitter.com/hackingbutlegal/status/1500465032966062082?s=20&t=R_uT2rc-mc7T1ywtUeejgA
Similarly, the Chief of General Staff of the Armed Forces of Belarus reportedly resigned – he said he couldn’t support the invasion and furthermore his troops refuse to go to Ukraine. (Interfax, the Ukraine news agency, is great for information on the conflict.)
I would remind everyone of how the Czar fell in 1917. Russia had suffered high casualties in WWI and the economy was destroyed by the war effort. Demonstrators clamoring for bread took to the streets in Petrograd (now St Petersburg). The troops were called out to disperse them but after a few days they refused to fire on the people and turned on the government instead. End of the Czar. Is a re-run possible?
On the other hand…there’s a lot of evidence that the invasion is quite popular back home. While some people are protesting at great personal risk, others are said to be “proud and enthusiastic.” Unfortunately we may have to see how many body bags it takes to dampen their enthusiasm. See this thread: https://twitter.com/kamilkazani/status/1500495309595725831
Commitments of Traders (CoT) report
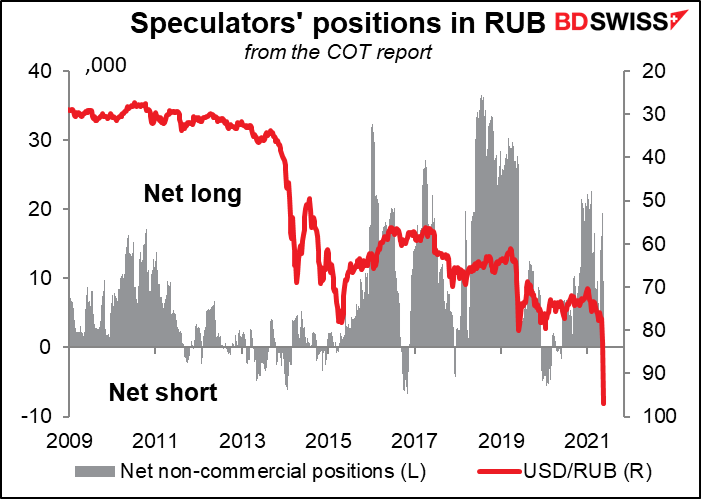
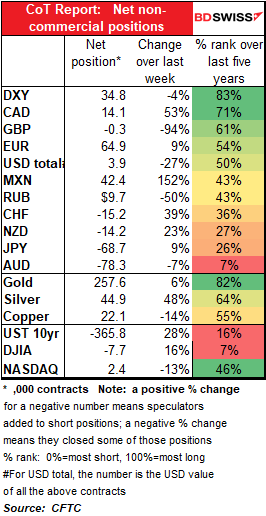
Let’s get right to the fun bit: the positioning in RUB. Speculators cut their net long positions in RUB by half, but remain long.
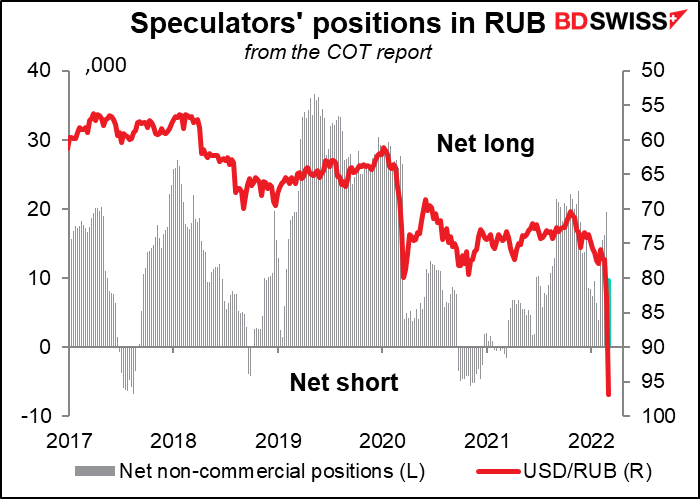
(you can see it better without the USD/RUB line in there.)
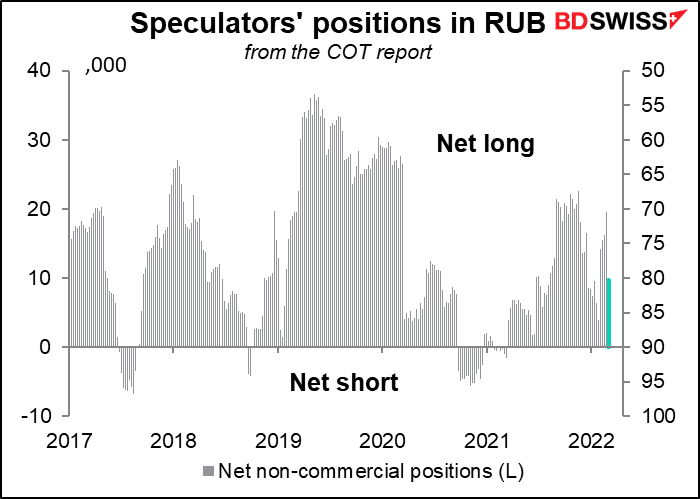
There’s probably something going on here that I don’t understand. Specs have been consistently long RUB for years even though the currency has been consistently declining for years. OK maybe in 2015/16 and then also in 2018 they might’ve made some money in this trade but otherwise it seems to be consistently a losing proposition. I don’t understand why they’d maintain a consistently losing position for so long unless it’s a hedge against something else, although by definition “speculators” are those who are not engaged in hedging.
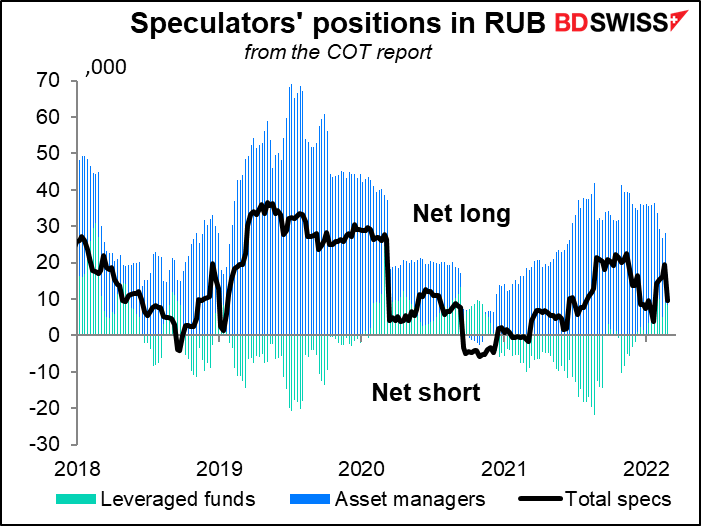
Both hedge funds and asset managers – the so-called “smart money” – were still long on Tuesday. (Note that the overall position of speculators doesn’t equate to hedge funds, asset managers, and “others,” as I thought last week.) Maybe they hope to make a bundle when the fighting stops, the sanctions are lifted, and the ruble recovers. If and when.
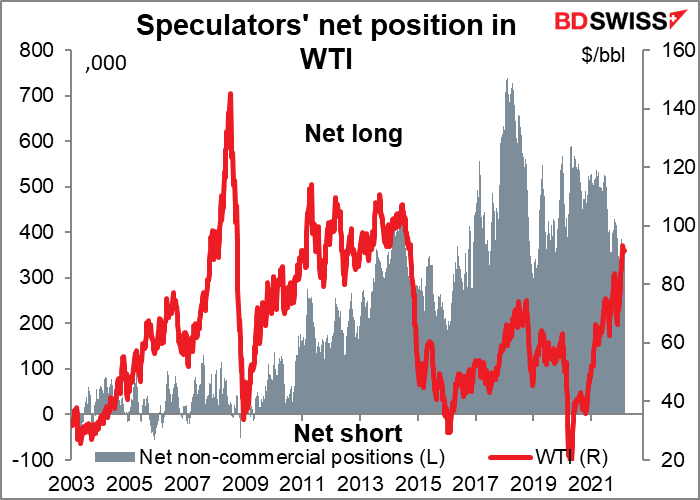
The positioning in oil – the US benchmark West Texas Intermediate to be precise – has also been baffling. There hasn’t been the kind of increase in long positions one might’ve expected given the surge in prices. EG as prices rose from around $30/bbl in January 2016 to $74/bbl in October 2018, net longs rose 4x from 180k to 735k a few months before oil peaked. This suggests to me that there’s still a lot of room for oil to move higher as trend-followers jump on the bandwagon.
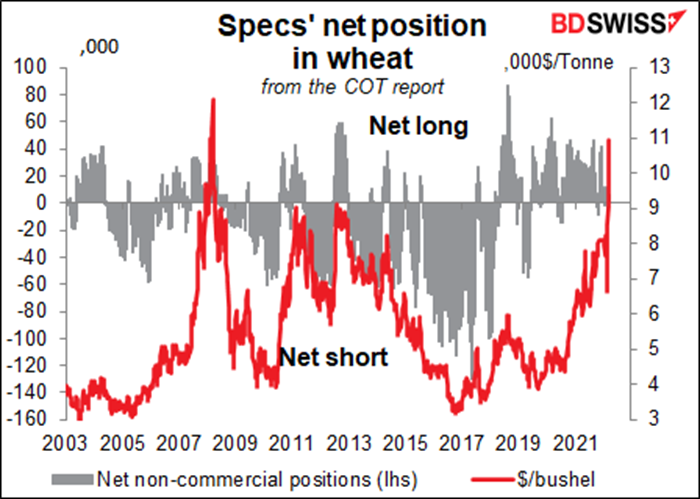
Speculators are also negligibly long wheat. It seems to me they could still pile on this bandwagon, pushing prices still higher.
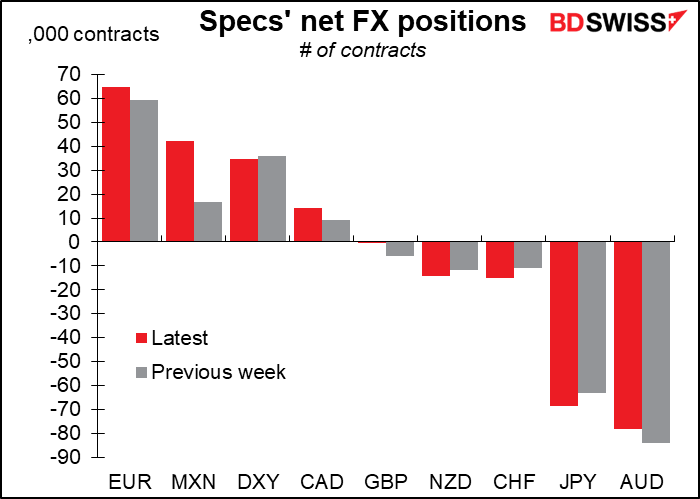
Overall, specs generally increased their positions whatever they were – going longer the longs, shorter the shorts. The only exceptions were GBP (went more or less flat after being short) and AUD (trimmed shorts). The sharp rise in long MXN positions was particularly noticeable, up 151% on the week. It looks like speculators are positioning for higher oil prices via MXN more than CAD, although CAD longs were up 53% on the week.
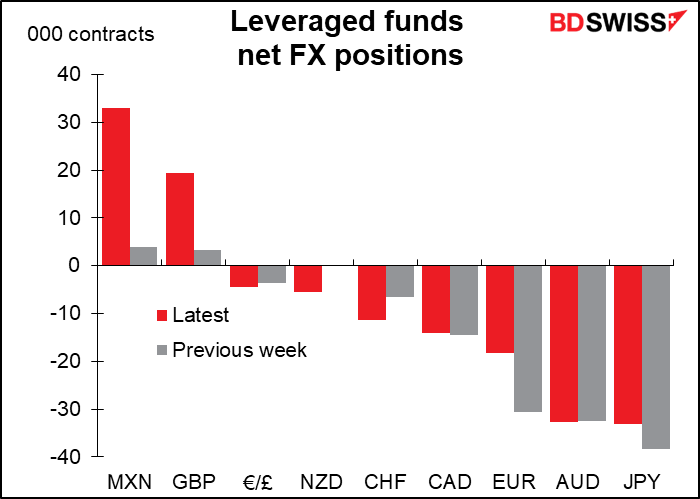
Hedge funds went fantastically bullish MXN and GBP while becoming more bearish on CHF. Those would seem to be contradictory plays – bullish MXN on higher oil prices but bearish CHF on thoughts of an end to the “flight to safety” trade? Or maybe speculation about Swiss National Bank intervention (see below).
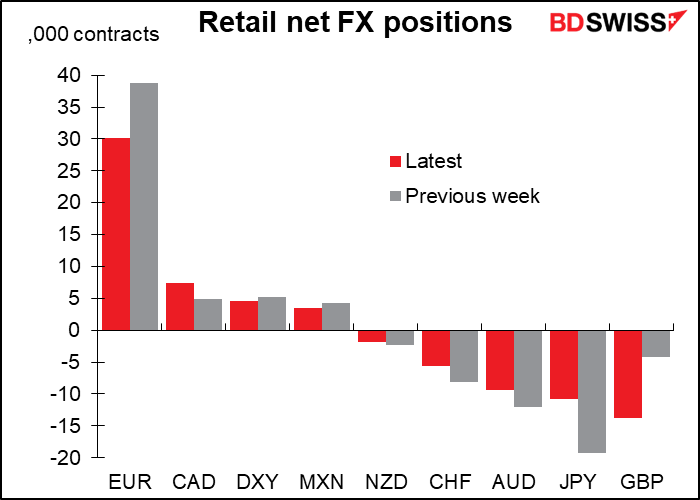
Retail trimmed most of their positions, especially their long EUR and short JPY. The only position they expanded notably was short GBP.
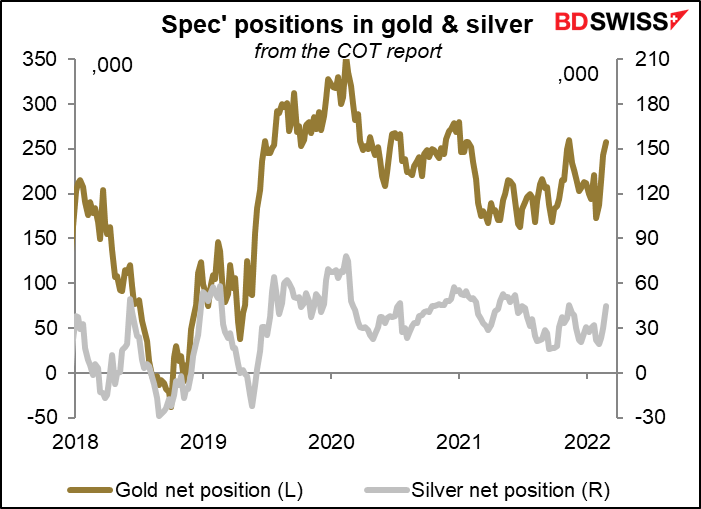
Specs increased their long gold and silver positions.
Today’s market
Note: The table above is updated before publication with the latest consensus forecasts. However, the text & charts are prepared ahead of time. Therefore there can be discrepancies between the forecasts given in the table above and in the text & charts.
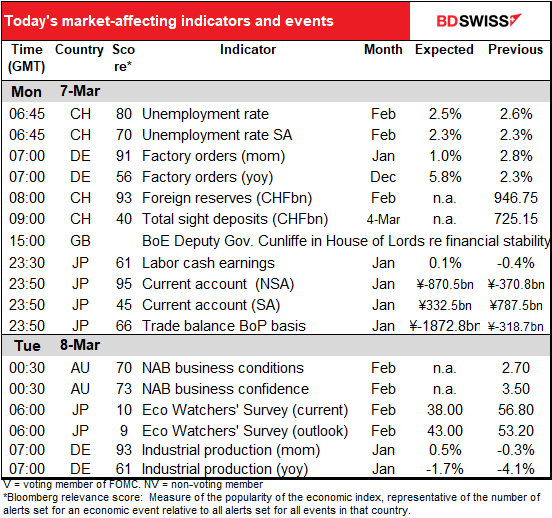
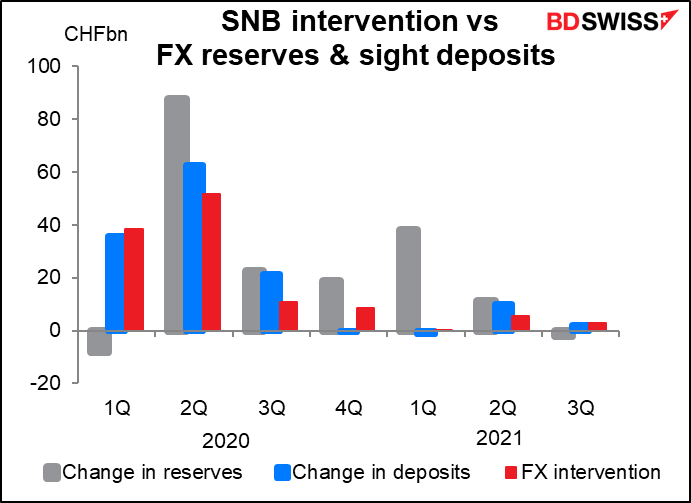
Today we get Swiss foreign reserves followed an hour later by Swiss sight deposits. The foreign reserve data has a very high Bloomberg relevance score, meaning that most of the people who watch Swiss indicators watch this one. Presumably they are looking at it as a guide to the Swiss National Bank (SNB) intervention in the FX market. However, as I point out every month, the weekly sight deposit data is more reliable than the FX reserve figures for gauging intervention.
We know that because the SNB releases data on its intervention. Comparing those figures with the data on reserves and deposits, it’s clear that the sight deposit data (blue bars) is better correlated with the FX intervention (red bars) than the change in reserves (grey bars). The change in sight deposits is 98% correlated with the FX intervention whereas the change in reserves is only 48% correlated. That’s because valuation changes on the stock of reserves can outweigh any changes in the flow of reserves. The sight deposit figures though are all in CHF and therefore aren’t affected by this problem.
And that’s it for the European day! I’d suggest that you head down to the beach and chill for the rest of the day, but in most countries that isn’t really an option in March, unless you want to use the traditional meaning of the word “chill.” But I’m sure you picked up some technical trading ideas from our webinar this morning that can keep you busy trading all day.
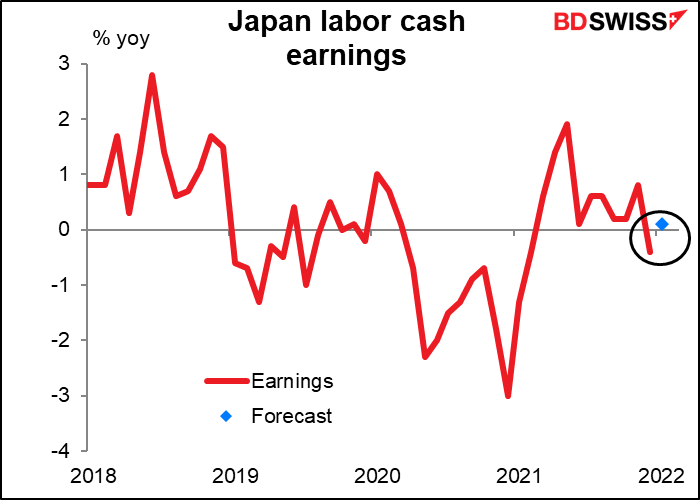
Overnight we get Japan’s labor cash earnings. This should be an important indicator but isn’t.
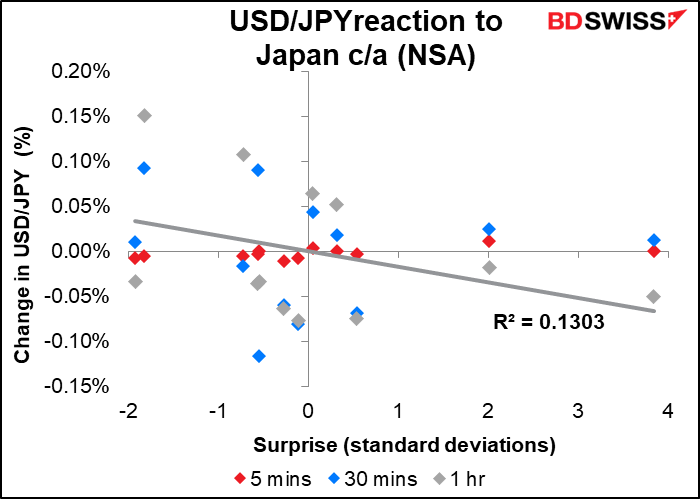
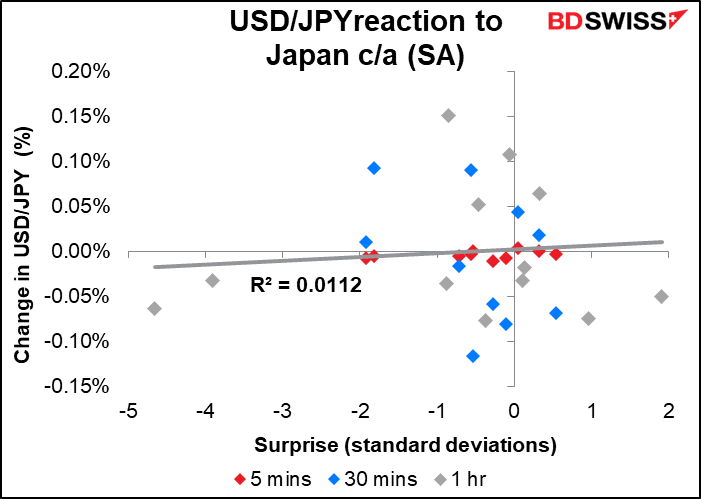
I thought Japan’s current account balance would be significant for the markets, but it seems to me that there’s relatively little connection between the data and the movement in USD/JPY. Other currencies are even less correlated. There is somewhat of a correlation at the 5-minute level, but that’s only because the currency doesn’t move! The highest correlation is with the surprise in the non-seasonally adjusted data after one hour. The NSA data also has the higher Bloomberg relevance score, so that makes sense.
EUR/JPY, GBP/JPY, and AUD/JPY have no better correlation, either.
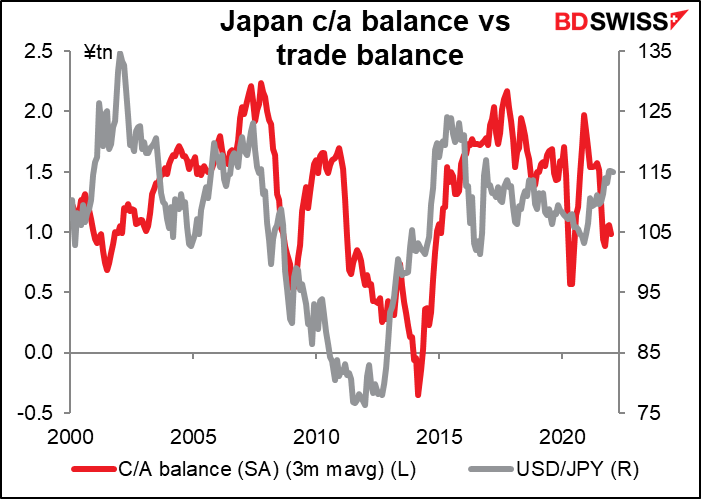
There does seem to be a connection, but it’s not the case — as one might imagine — that a higher current account surplus leads to a stronger JPY. On the contrary, just by eyeballing the figures it looks as if the causality goes in the other direction – that a weaker yen causes a higher current account surplus.
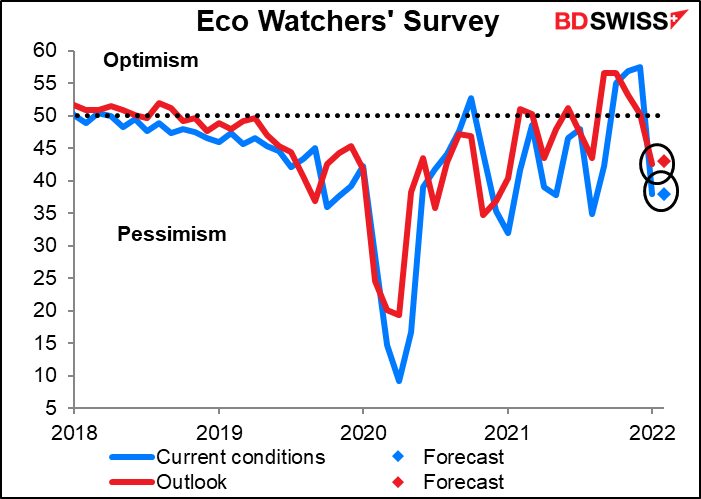
Completing the trifecta of pointless Japanese economic indicators today is the usually ignored Eco Watcher’s Survey. It’s a shame no one watches it, because it predicts the much-more-popular tertiary sector index pretty well while coming out a month or so earlier. It’s also more responsive than the service-sector purchasing managers’ index, which does garner some attention (although no forecasts). Anyway both the current conditions and outlook indices are expected to be barely changed so this is not likely to be the month that the world suddenly starts paying attention to this indicator.
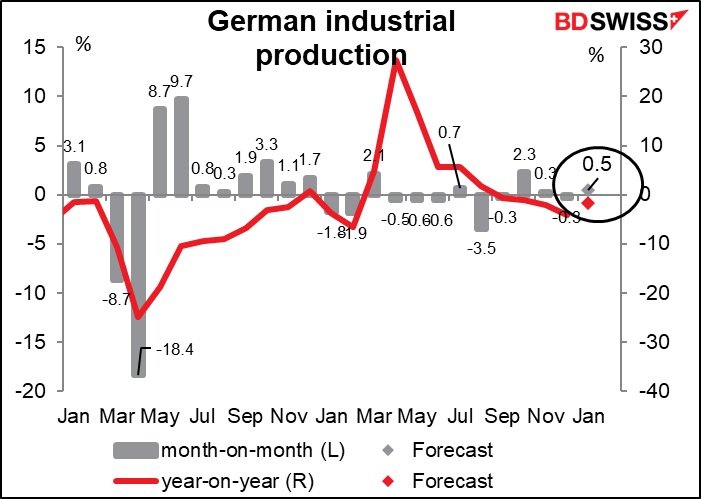
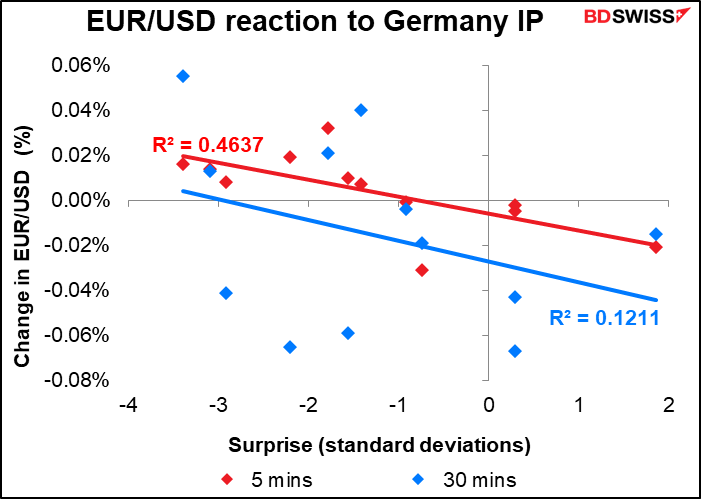
Then tomorrow morning, Germany releases its industrial production figure. It’s expected to be up modestly but below the 3-month moving average of 0.85 mom.
It’s surprising to me how much better orders (blue bars) have recovered than production (red bars). Monday morning’s factory orders figure is expected to be 5.5% above the pre-pandemic average, while production is forecast to be 6.0% below.
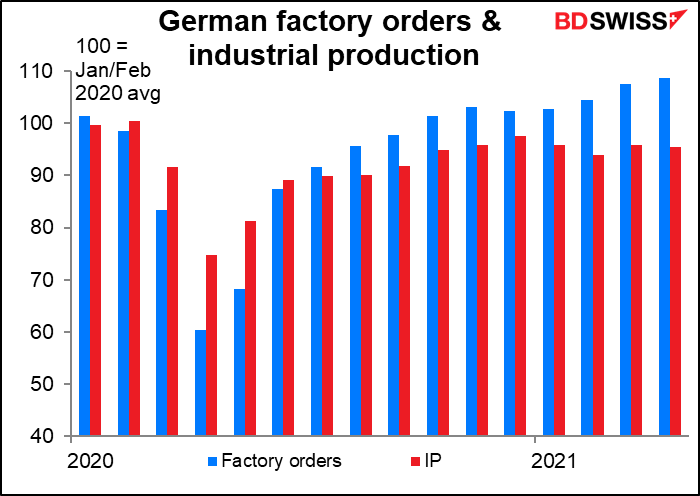
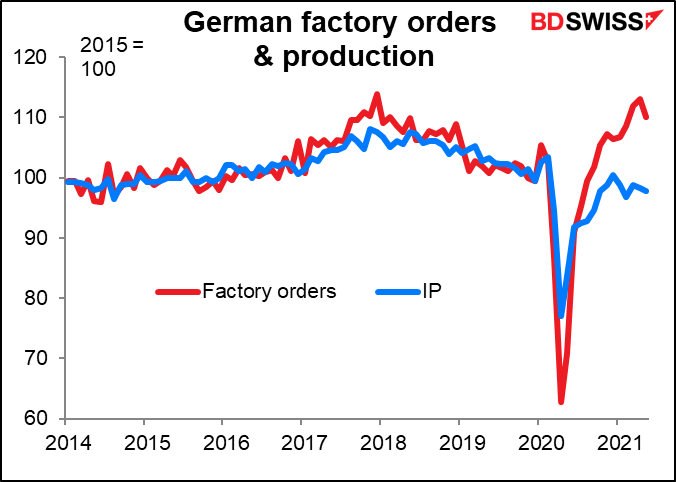
The two series used to move closely in line but not since the pandemic hit. Orders collapsed far more than production did and then have bounced back more.
Source: BDSwiss