This week, the same pattern applies with demand for EM currencies and European indices returning to their starting positions before Friday’s collapse. The announced talks between the Russian and US foreign ministers and the chances of a summit between Biden and Putin bring back hopes of a peaceful resolution. However, it is worth realising that the situation remains fragile, and so far, with each new cycle of this momentum, the present situation has become more dramatic.
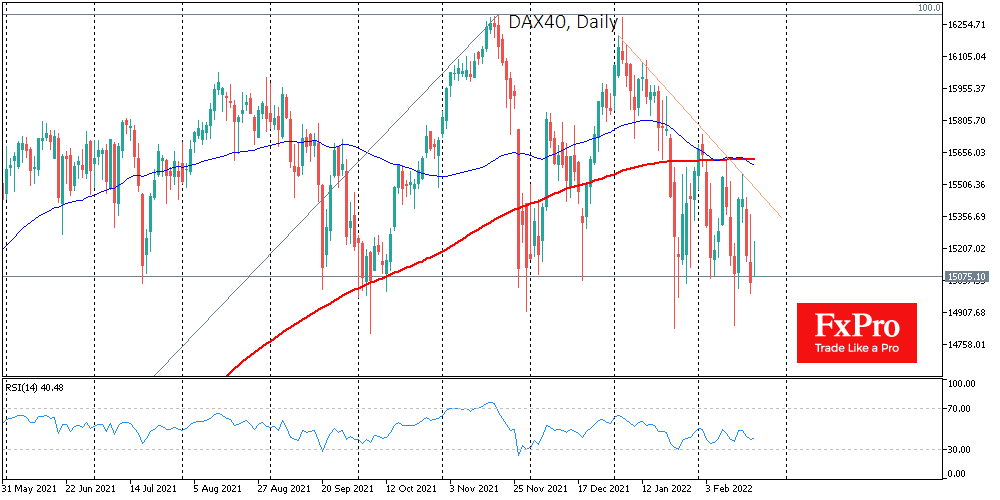
And this is visible in the dynamics of the European indices, where the DAX formed a double top in January and in February began to churn in line with the geopolitical background, maintaining a downward bias and approaching a critical support level that has been in place since last May.
The pressure on the DAX to consolidate under the 15,000 mark is occurring on two fronts at once.
Firstly, geopolitical tensions are reducing the traction in risky assets of the European region. In addition, fears of energy supply disruptions in the EU due to Russia form the background, with high oil and gas prices holding back the economic recovery.
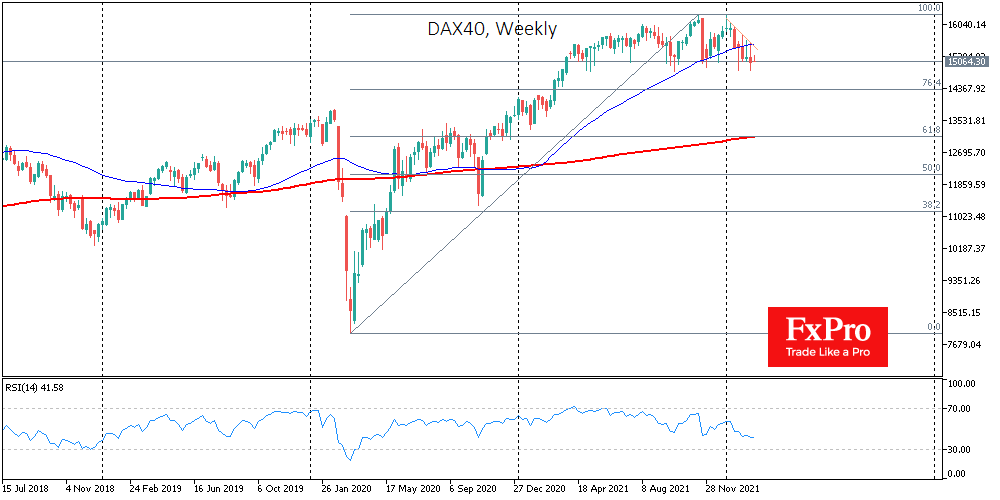
Secondly, the monetary policy outlook continues to be reassessed. ECB officials are talking more and more confidently about a rate hike this year and leaving the door open for such a move as early as September. If the bears manage to push the DAX below the nine-month support, we might see an acceleration of the corrective pullback that could take the index down to 14000 within the next couple of weeks. If the politicians’ rhetoric doesn’t seem to be easing, the next target for a retracement might be the 13000-area, a 61.8% Fibonacci retracement of the extremes of March 2020 and November 2021.
Source: FXPro