Rates as of 06:00 GMT
Market Recap
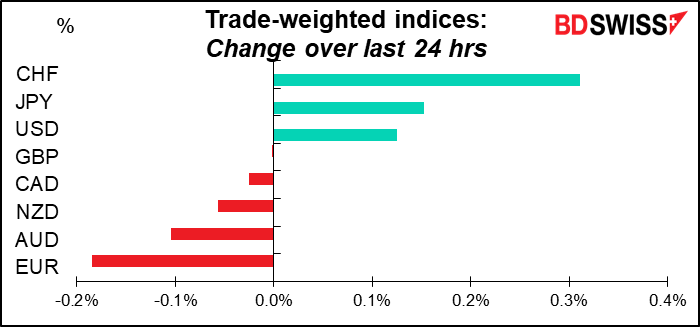
A much quieter day in the FX market.
The big move was in EUR/CHF, which appears finally to have caught the whiff of war in Ukraine.
Yesterday I mentioned that the risk reversals hadn’t been showing much concern over the possibility of war. I think I spoke too soon.
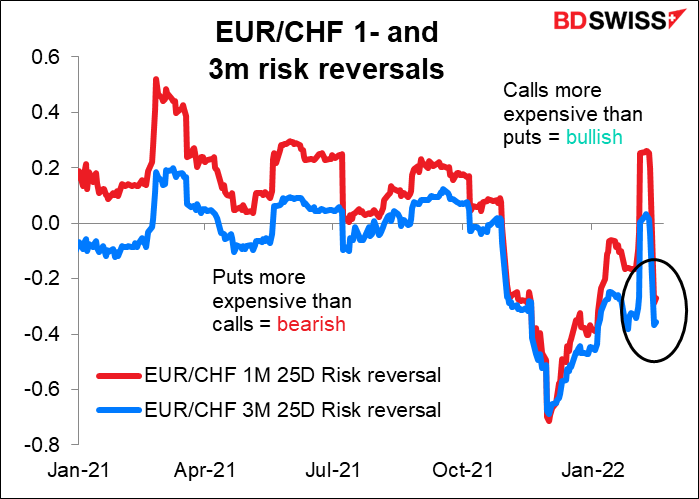
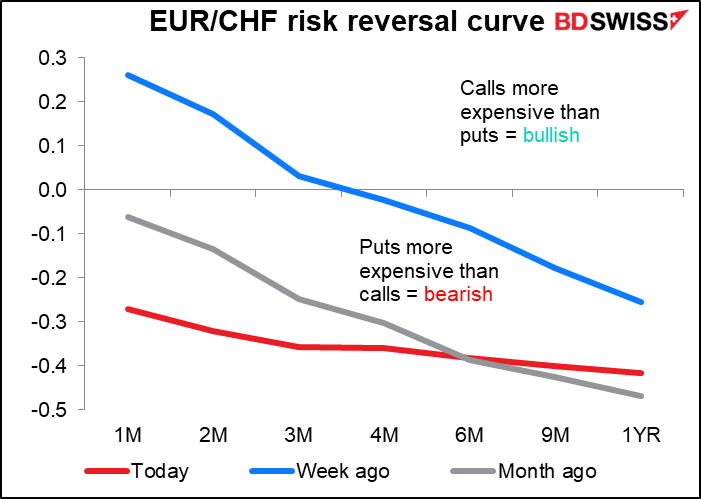
It still surprises me though that the RR curve isn’t showing any particular concern about near-term downside risk for the pair. That is, if people were worried about the impact of fighting soon, the one- and two-month RRs would probably be a lot lower than the 1-year RR. But that’s not the case; they’re ever-so-slightly higher. That makes me wonder whether people are hedging against what President Putin will do or what President Lagarde will do.
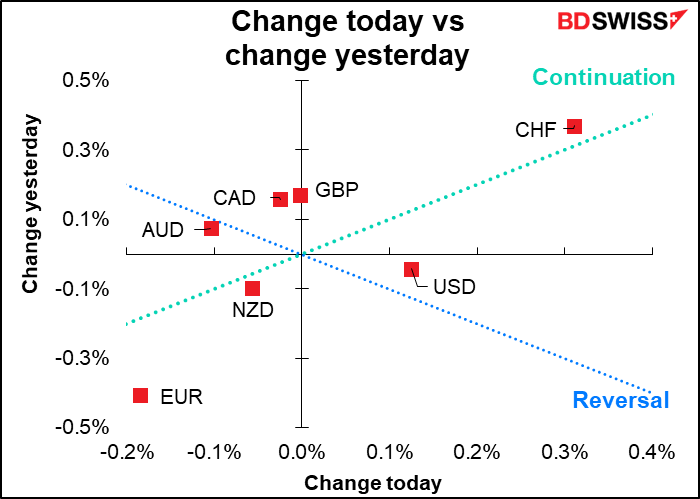
Otherwise it was just a typical “risk-off” market, with JPY gaining and the three commodity currencies losing. CAD again weakened despite higher oil prices. Gold and silver both continued to move higher.
Bond yields generally rose despite the risk-off tone as markets continue to price in further tightening by central banks.
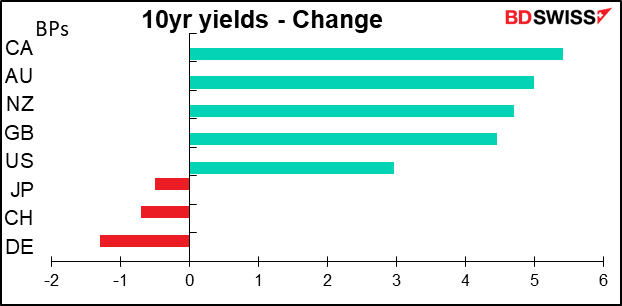
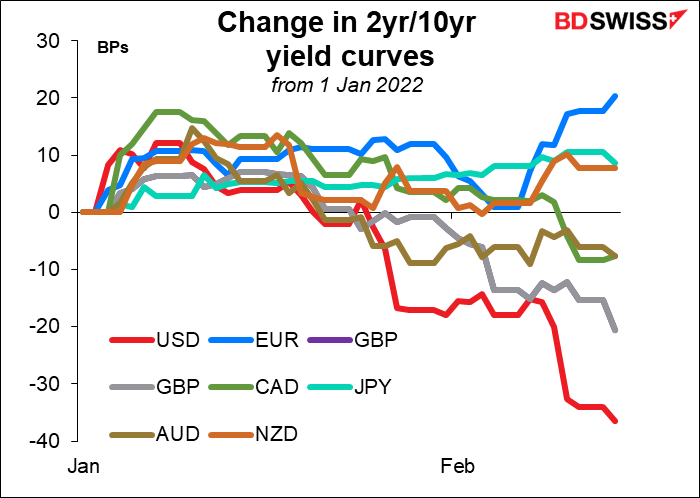
Reflecting the tightening bias, the US and UK yield curves flattened further. The Eurozone curve however steepened as 2yr yields declined 4 bps and 10-years -2 bps. it looks like ECB President Lagarde may be getting her message through after all.
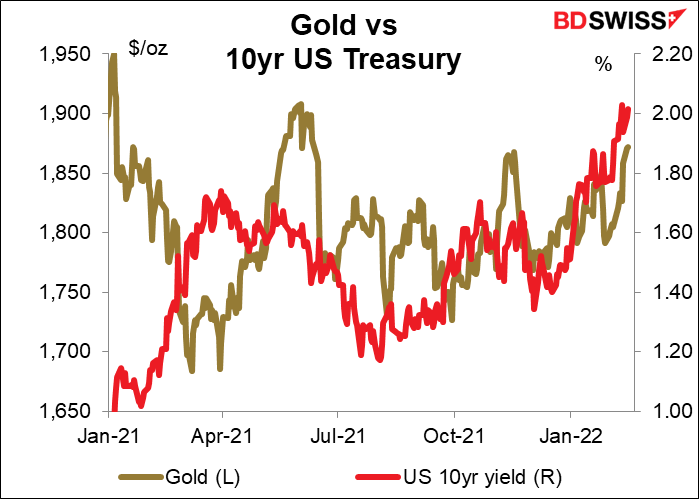
Gold followed Treasury yields higher again. Often higher interest rates would tend to be negative for gold, but higher inflation expectations might tend to push both gold and bond yields higher. In this case I think gold is moving higher on risk aversion while Treasury yields are ignoring the risk aversion and moving higher on expectations of Fed tightening.
Today everyone will be watching to see how German Chancellor Scholz’s trip to Moscow goes. The headlines from there are likely to be the main market-moving events of the day.
Today’s market
Note: The table above is updated before publication with the latest consensus forecasts. However, the text & charts are prepared ahead of time. Therefore there can be discrepancies between the forecasts given in the table above and in the text & charts.
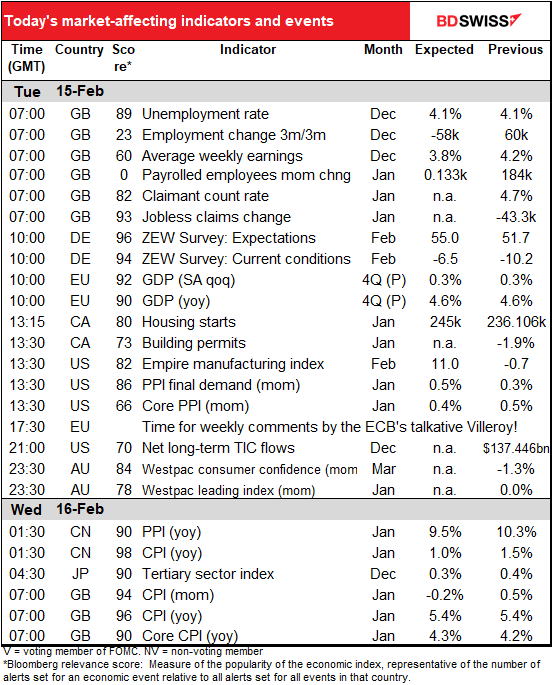
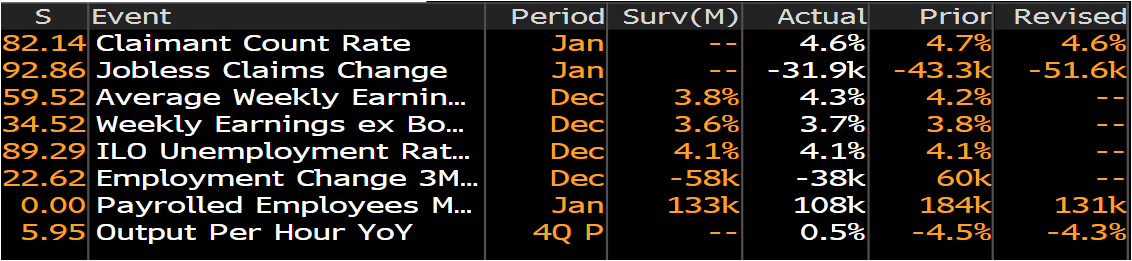
The UK employment data are out already. They’re an interesting test of which is the most bit of information here: The unemployment rate was as expected to no impact there. Employment fell less than expected in December, so that was good, but payrolled employees rose less than expected in January, so that was bad. Net net, are the figures good or bad? I’d say bad because I think the payrolled employees is now the most important figure. Also weekly earnings rose by more than expected and the Bank of England has warned everyone that they have to “moderate” their wage requests (everyone except Bank of England employees, presumably).
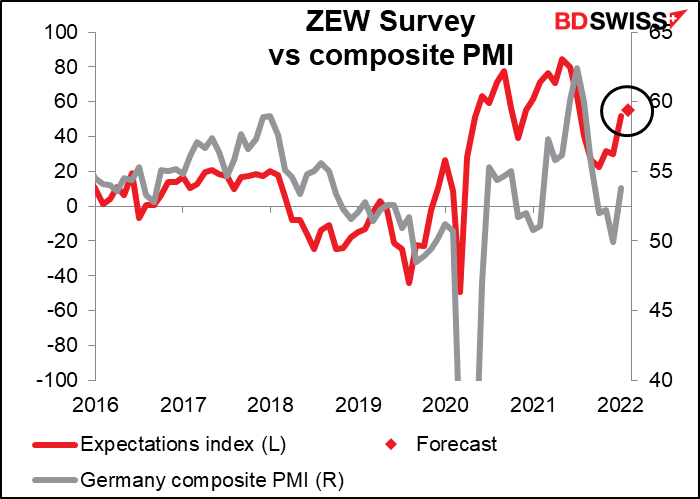
So next up is the ZEW survey of analysts & economists. Both the current conditions and expectations indices are forecast to rise.
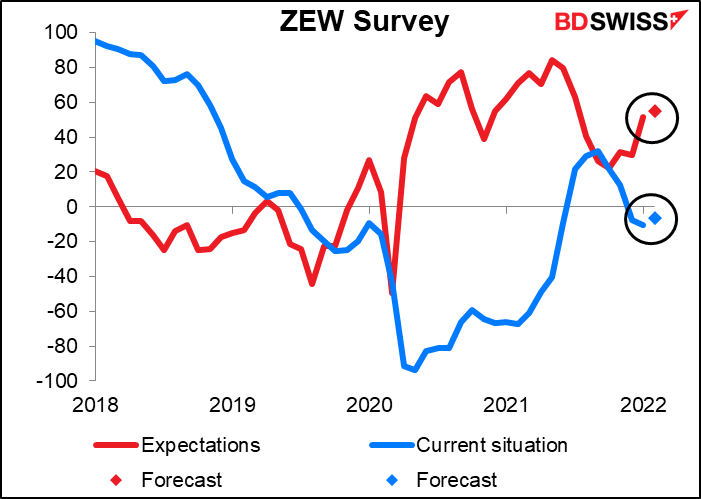
That would be in line with the stunning 3.9-point increase in Germany’s composite purchasing managers’ index (PMI) during the month.
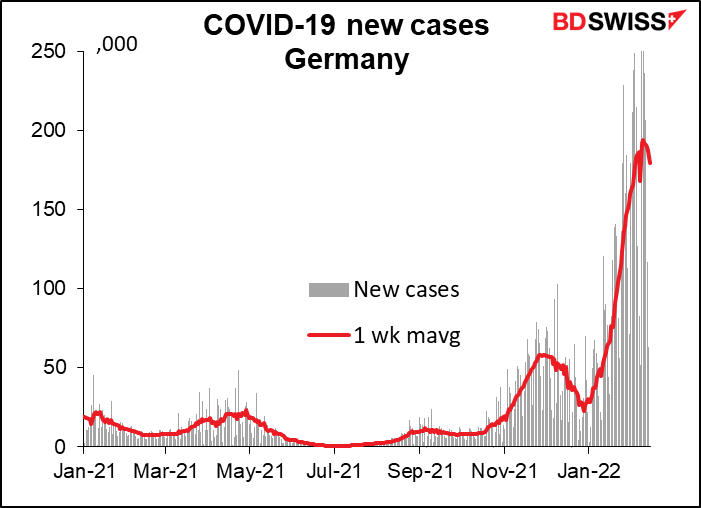
However since virus cases only peaked on Feb. 9th I wonder if it’s a bit premature to be getting more optimistic. On the other hand, people don’t seem to be as worried about the virus as they used to be, so perhaps they’re shrugging it off.
The second estimate of Eurozone Q4 GDP is coming out. This is rarely revised by more than 10 bps or so and therefore isn’t much of a concern. It’s marked P for Provisional, but that’s because the first estimate is A for Advance.
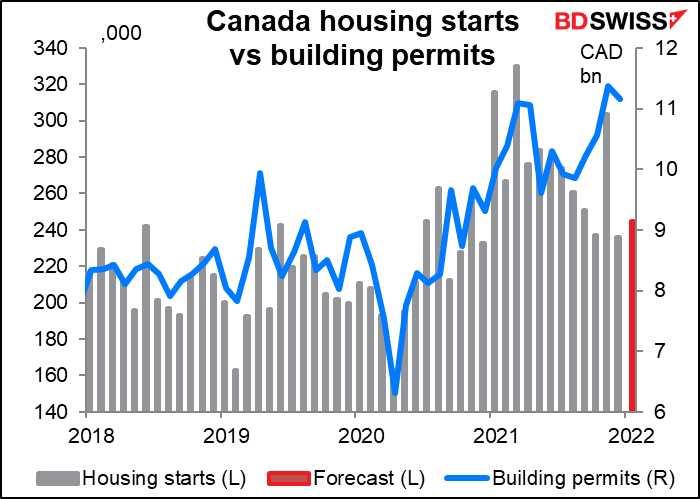
Canadian housing starts are expected to be up slightly. I have to confess I have no particular insight into Canada’s housing market.
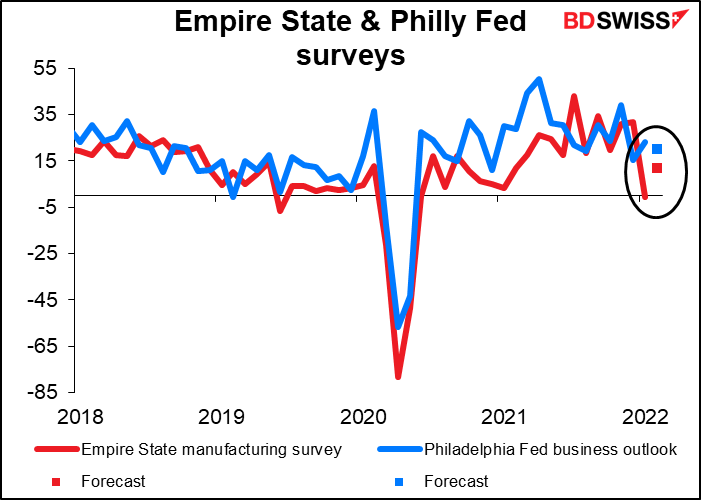
The Empire State manufacturing survey kicks off the monthly Fed regional surveys for February. The forecast usually seems to be mean reversion with the Philadelphia Fed business survey. That is, they are usually expected to move toward each other. So after a month like January, when the Empire survey unexpectedly plunged but the Philly Fed survey rose, the Empire survey is expected to rise a bit and the Philly survey to fall a bit. In any event, they’re both expected to continue in positive territory, showing that the US economy continues to expand, albeit at a modest pace. The Atlanta Fed’s GDPNow estimate of Q1 GDP is 0.7% qoq SAAR, which would be a big slowdown from 6.9% qoq SAAR in Q4.
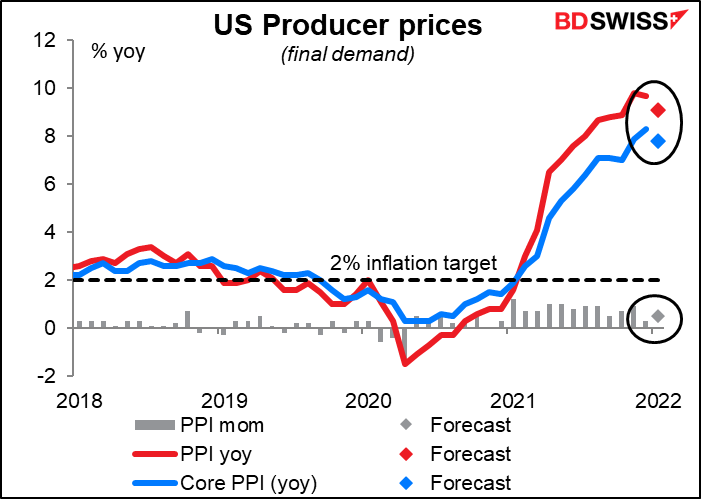
The US producer price index (PPI) is expected to show a healthy mom increase but for the yoy rate of change to slow. Will this be taken as a sign that inflationary pressures are peaking?
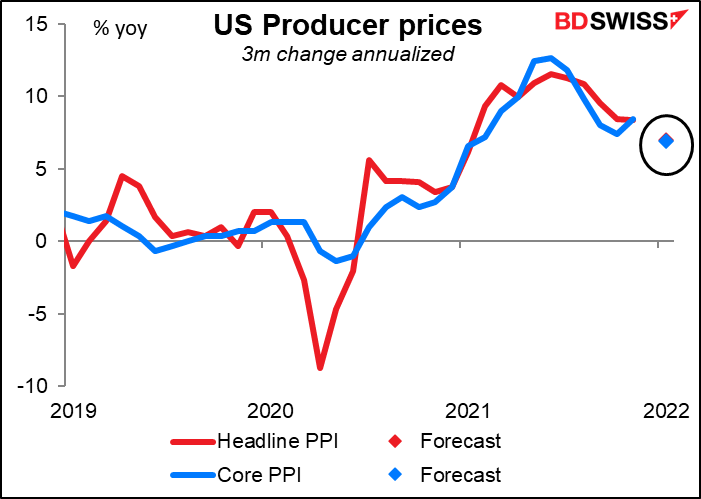
It looks that way – the 3m annualized change in the PPI is also forecast to slow. This might take some pressure off the Fed to hike rates and therefore could be negative for the dollar.
However the connection between the PPI and the CPI isn’t that straightforward. If you’re interested in what one means for the other, see my research piece on the subject: The PPI and the CPI: what’s the connection?
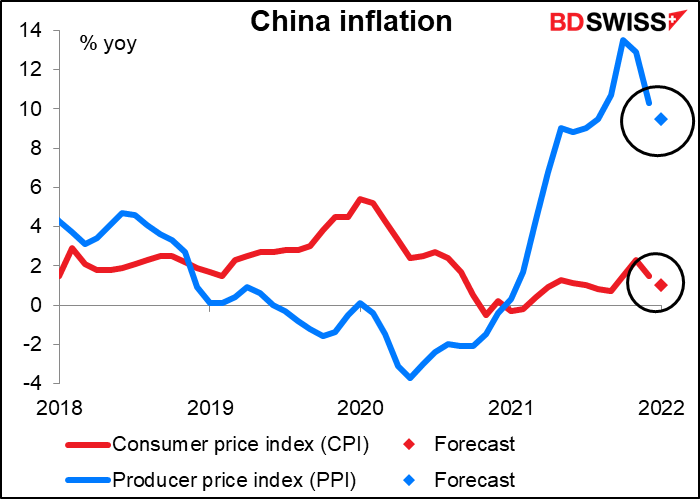
Overnight, China also announces its PPI as well as its consumer price index (CPI). The PPI is the more important one for global markets because China’s PPI is a major component of other countries’ import price index.
In this case, both are slowing, particularly the PPI. This too could be taken as a sign that the worst of the inflationary impulses is behind us. Of course slower inflation doesn’t mean falling prices, it just means that prices increase at a slower pace. Nonetheless even that will be welcome as it would allow central banks to get away with tightening less. In that respect a slowdown in the Chinese PMI could be positive for AUD.
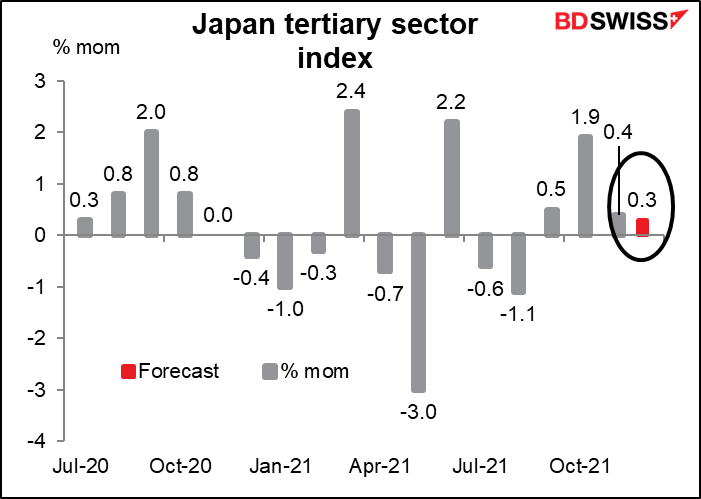
Japan’s tertiary sector index is expected to be up a modest 0.3% mom in December. That would be contrary to the Japan service-sector purchasing managers’ index for the month, which was down 0.9 point. The Eco Watcher’s Survey (EWS) was up 0.7 point but the tertiary sector index has a better correlation with the PMI than the EWS.
In any case both the service-sector PMI and the EWS crashed in January so I don’t think the December tertiary sector index will be of that much importance. In fact I can’t understand why it has such a high Bloomberg relevance score to begin with, but that’s just me.
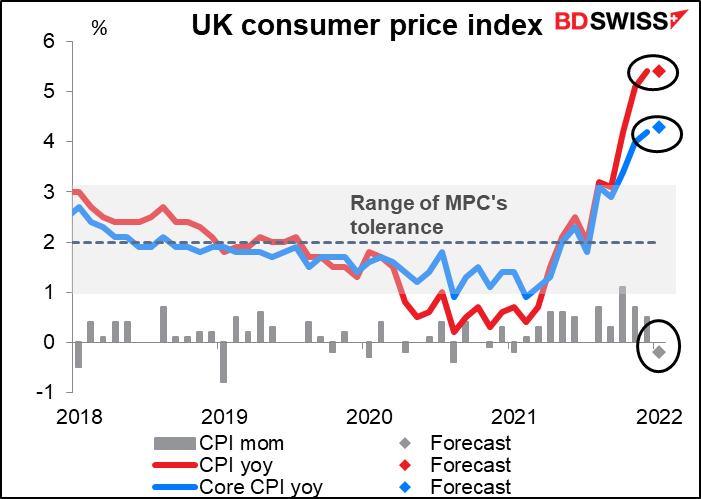
So then we wait until it’s morning in London…Wednesday morning at 7 o’clock as the day begins, Britain announces its consumer price index (CPI). It’s expected to show a drop in prices from the previous month, while the yoy rate of prices is expected to stay the same (for the headline figure at least – the core rate is expected to rise by 0.10 percentage point).
Does that mean inflation has peaked in Britain? Hah! What a ridiculous question! Don’t make me laugh! Everyone is just waiting for April, when the yearly energy bill slides through everyone’s mail slot and falls to the floor with a heavy clank since they’re expected to be some 54% heavier than last year. The Bank of England expects inflation to peak at around 7 ¼%. I therefore expect the market will largely ignore this figure as simply the “calm before the storm” and nothing that will deter the Monetary Policy Committee from raising interest rates higher and higher.
Source: BDSwiss