Note: The table above is updated before publication with the latest consensus forecasts. However, the text & charts are prepared ahead of time. Therefore there can be discrepancies between the forecasts given in the table above and in the text & charts.
Rates as of 05:00 GMT
Market Recap
A fairly quiet day on Wall Street, with the S&P 500 virtually unchanged but the NASDAQ climbing ever higher.
The European Central Bank (ECB) followed the pattern of the Bank of Canada and Bank of Japan in downgrading current conditions but upgrading the outlook. ECB President Lagarde suggested that Q1 this year might show a decline in output, but was notably more positive about the medium-term outlook. (“Looking ahead, the roll-out of vaccines, which started in late December, allows for greater confidence in the resolution of the health crisis…The news about the prospects for the global economy, the agreement on future EU-UK relations and the start of vaccination campaigns is encouraging…”) Otherwise there was little of note from the meeting, as expected.
There was so little change that analysts jumped on the fact that they took their comment that the Pandemic Emergency Purchase Program (PEPP) “need not be used in full” from the December press conference and added it to the initial statement following the meeting, which added a bit of emphasis to this small hawkish point.
Admittedly, Lagarde seemed far more concerned about the exchange rate than I had expected. During the press conference, she had this to say in response to a question about “the strengthening of the euro” although as I pointed out yesterday, the trade-weighted index is a bit lower now than it was in December. This is a threat that they will use monetary policy to affect the exchange rate, which is not considered appropriate in international policy circles.
On the strength of the euro, let me just tell you that we are monitoring very carefully exchange rates, very carefully, because we know that exchange rates have an impact on prices, and clearly play a part in our inflation forecast, and what we can deliver with our monetary policy. So, we are very attentive, and as I said earlier on, all instruments can be adjusted and nothing is off the table.
However, looking at this morning’s rates, her concern clearly didn’t affect the market –if anything, the fact that they emphasized the bit about the PEPP possibly not being used in full, plus the small upgrade to the outlook, were taken as EUR-positive.
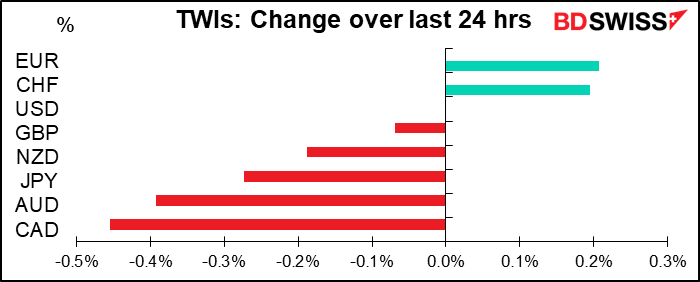
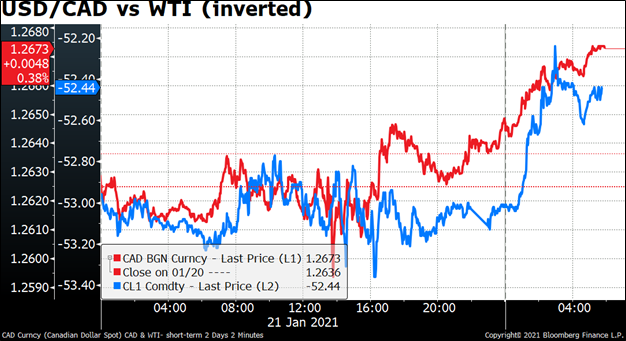
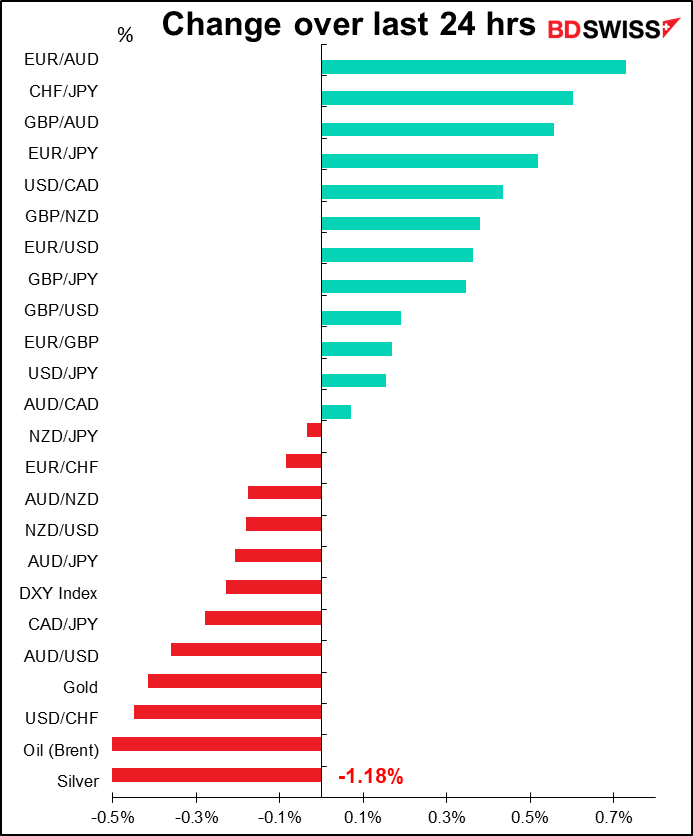
USD/CAD briefly hit a two-year low (= a two-year high for CAD) of 1.2590 yesterday after Bank of Canada Gov. Macklem said the nation’s economy is flush enough with stimulus to survive the current downturn and doesn’t need additional help from monetary policy. “If the economy plays out in line or stronger with our outlook, then the economy is not going to need as much quantitative easing stimulus over time,” Macklem said. While the central bank has several tools it can use if needed to add stimulus, “in our base case we don’t expect that we will need to use them.”
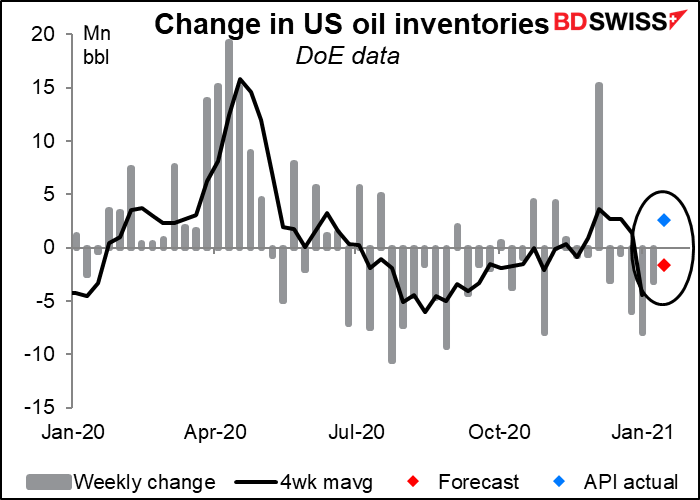
So why is CAD at the bottom of my chart this morning? In a word: oil. As I mention below, the American Petroleum Institute (API) reported a big rise in inventories for the latest week, contrary to market expectations for a fall. The US Dept of Energy releases its weekly oil statistics today instead of Thursday as usual because of the holiday on Monday.
I’m continually mystified by the good performance of GBP. I think the main thing driving it must be Bank of England Gov. Bailey’s hesitation about the idea of negative interest rates. The market has pushed back the pricing of a negative Bank Rate, to the point where it now sees only a 50% chance of a negative rate this year (i.e., -0.05% is priced in for December). But when I look at the forecasts for today’s UK purchasing managers’ indices (see below) and read about all the unintended (or maybe intended? Who knows?) consequences of the Brexit agreement that are gradually becoming clear, it seems more and more that the country is headed toward some variety of disaster. Adding to the country’s potential problems, the government hasn’t ruled out keeping England in lockdown until the summer. For now I would say “don’t fight the tape” but still, I can imagine a sudden turnaround in sentiment.
Today’s market
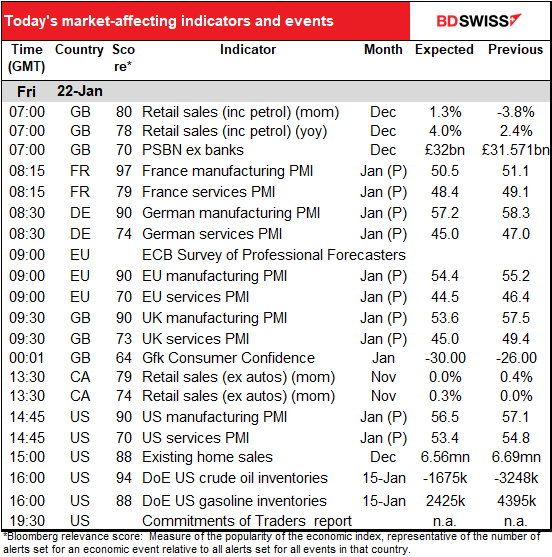
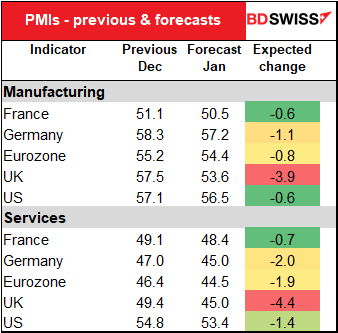
It’s all about the preliminary purchasing managers’ indices (PMIs) today. They’re expected to range from bad (France) to terrible (UK). Not one is forecast to rise. The manufacturing PMIs are at least expected to remain in expansionary territory, but the service-sector PMIs – which after all account for a greater part of the economy – are expected to fall further below the 50 line that signifies expansion. The exception is the US, where the service sector PMI is also expected to dip but to remain above 50.
I think most people are aware that the UK economy is in what they call in Scotland gehakte tsuris, but the substantial declines in the PMI
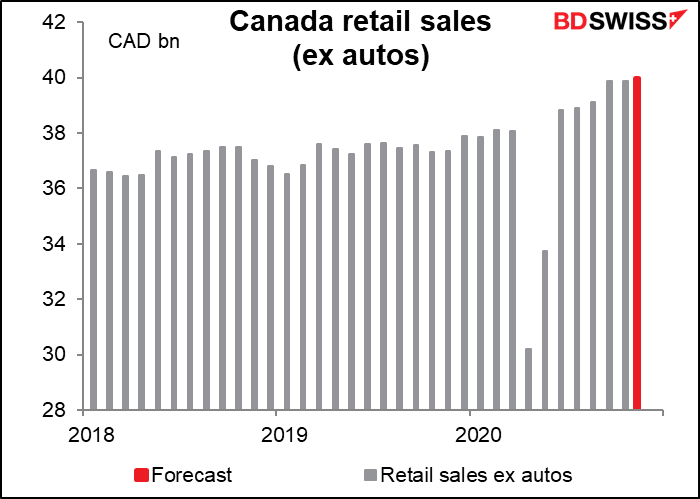
Canadian retail sales is another one of those indicators that’s been up and down wildly, so the best way to visualize it is by looking at the level of sales, not the month-on-month change. On today’s consensus forecast it would be 5.3% above the pre-pandemic level, which is pretty much par for the course nowadays. The trend isn’t very good though as it’s plateaued, but this will be no surprise to the Bank of Canada, which Wednesday said it expected the economy to contract this quarter. “Consumption is forecast to gain strength as parts of the economy reopen and confidence improves,” it said, so it’ll be willing to look through any near-term weakness.
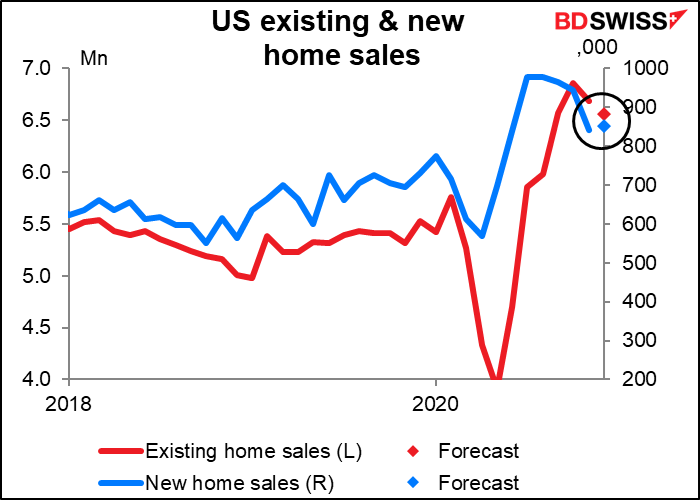
US existing home sales are forecast to be down slightly (-1.9% mom). New home sales, which come out next week, are expected to be up 1.4% so I don’t think this means the end of the US housing boom by any means.
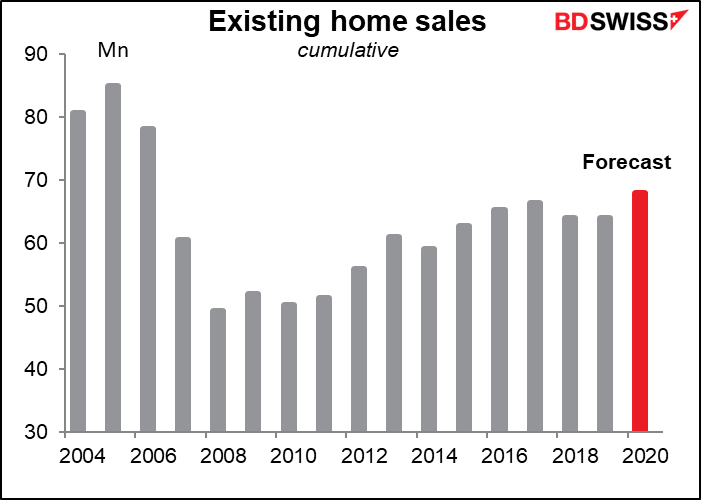
If this month’s forecast is correct, it would still be the biggest year for existing home sales since the housing boom of 2006. (Notice: this chart isn’t correct. The figure I’m adding up is the monthly number for new home sales at a SAAR, so adding them up doesn’t give the number of new homes sold during the year – it gives approximately 12x the number! However we don’t get a forecast for the actual number of new homes sold during the month, so I can’t do the calculation the way it really should be done.)
Oil inventories are expected to fall, but on the contrary the American Petroleum Institute (API) Wednesday announced a rise of some 2.6mn barrels for the week.
Source: BDSwiss