Rates as of 06:00 GMT
Market Recap
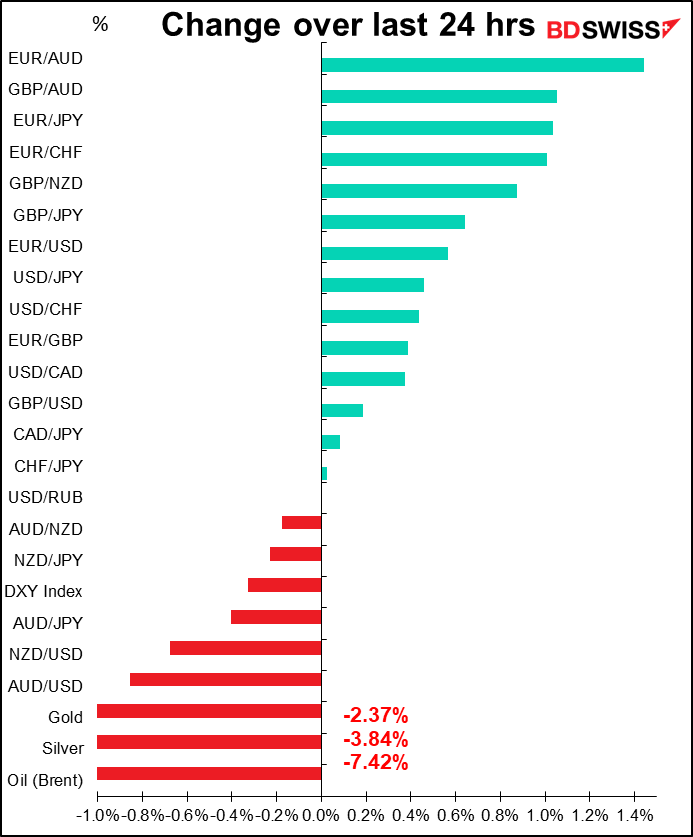
Just in case you ever thought markets were a one-way bet and it’s easy to make money trading, take a look at commodities today.
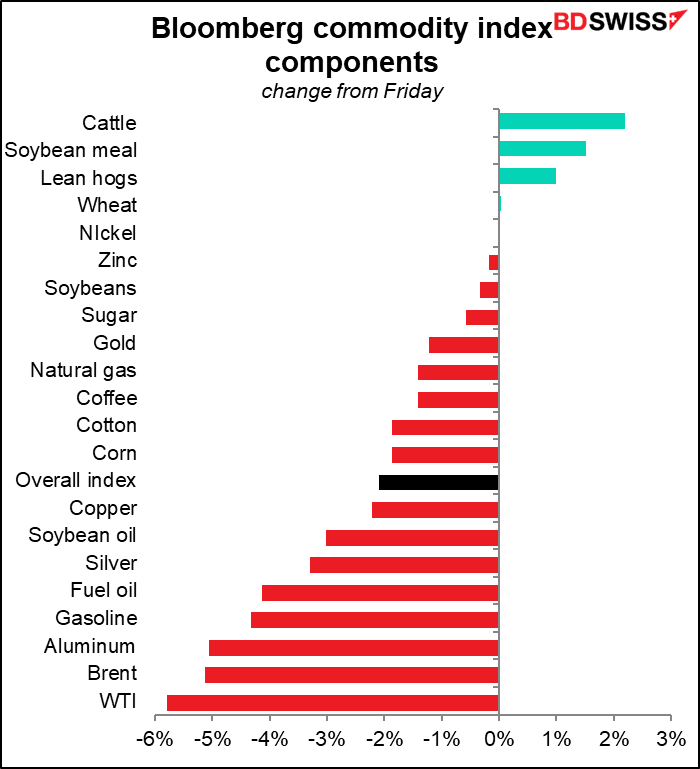
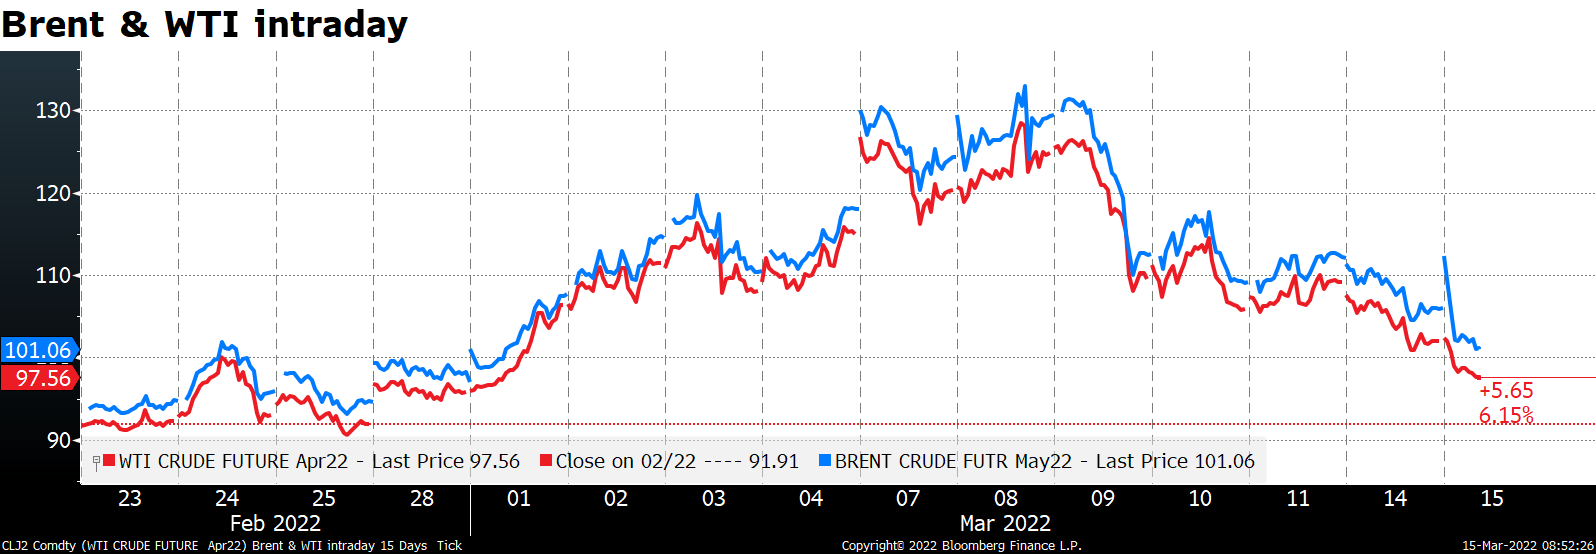
The fall in oil has been particularly spectacular. Brent topped $130/bbl a week ago, WTI was near there. Now they’re both down about 25% from their peak levels and back to around where they were on Feb. 24th, the first day of the invasion.
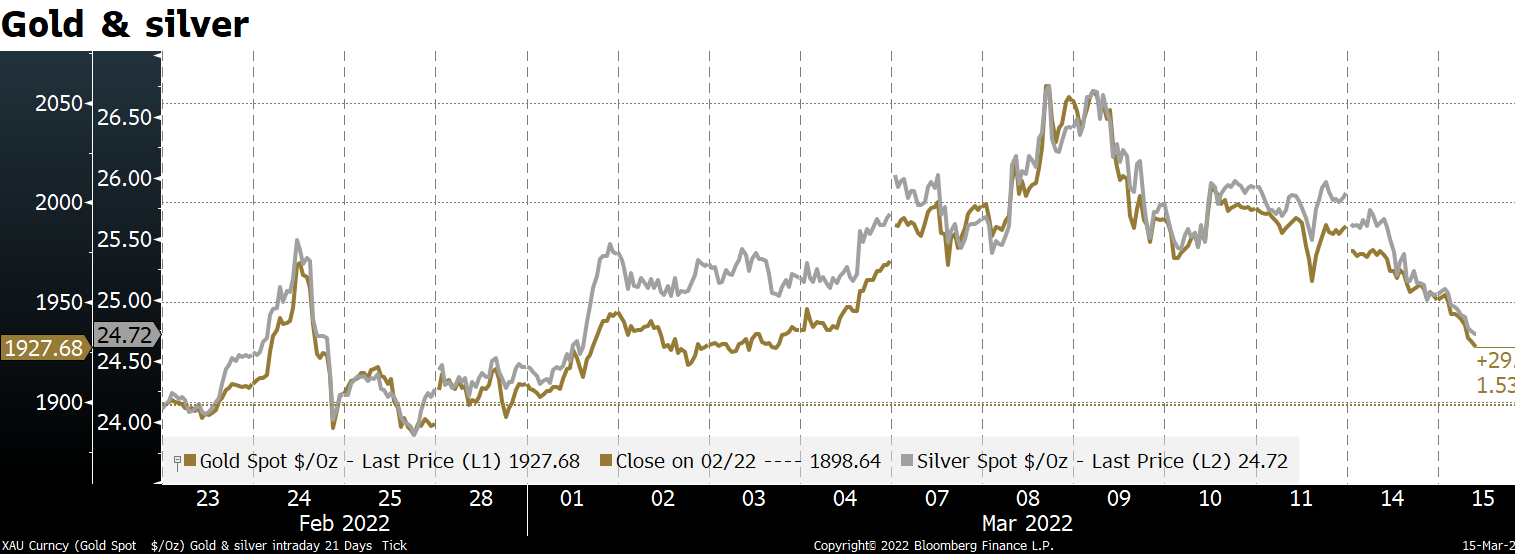
Gold and silver are still above their pre-invasion levels, but not by much.
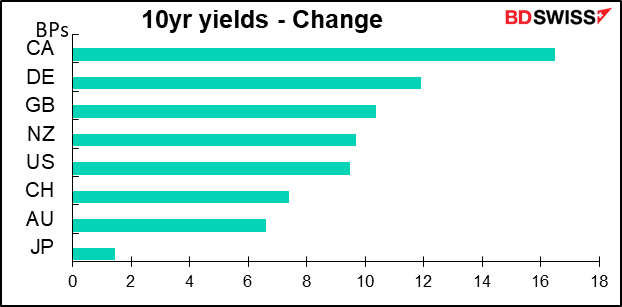
Why did they collapse today? One reason may be fear of higher interest rates. Bond yields jumped in all major markets.
Bonds are caught in between two conflicting forces. On the one hand, oil and gas prices got so high that they were no longer inflationary but rather were implying a recession was likely. That would cause bond yields to decline. On the other hand, the fall in oil prices over the last couple of days (see below) makes it more likely that central banks can (and therefore will) tighten policy without worrying about sending their economies into recession.
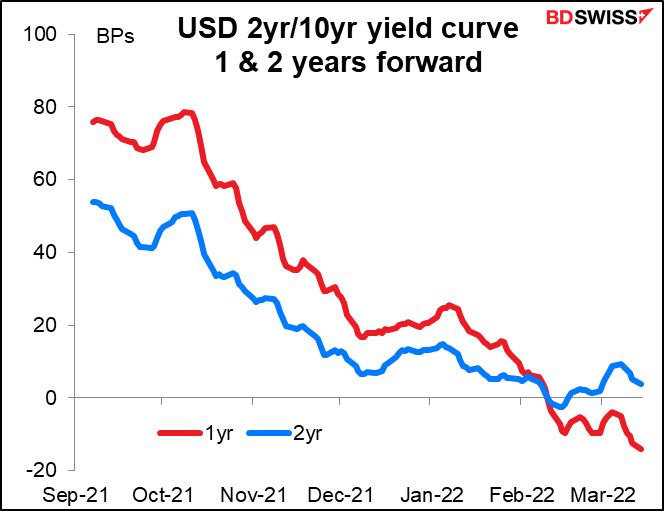
The one-year forward US yield curve (what the market expects the 2yr/10yr yield curve to be one year from now) is still signaling recession, but the two-year forward curve has started to steepen, indicating doubts creeping into peoples’ minds.
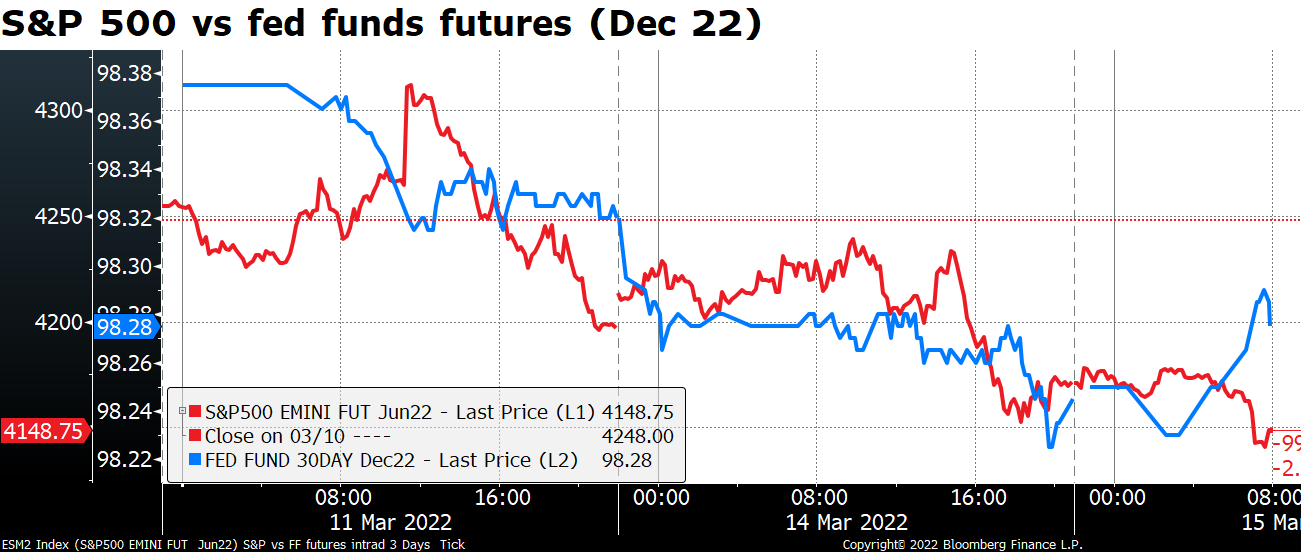
Expectations of further central bank tightening hit US equities yesterday too. You can see how the S&P 500 (red line) has been more or less tracking rate expectations for end-December (blue line – lower = higher rate expectations).
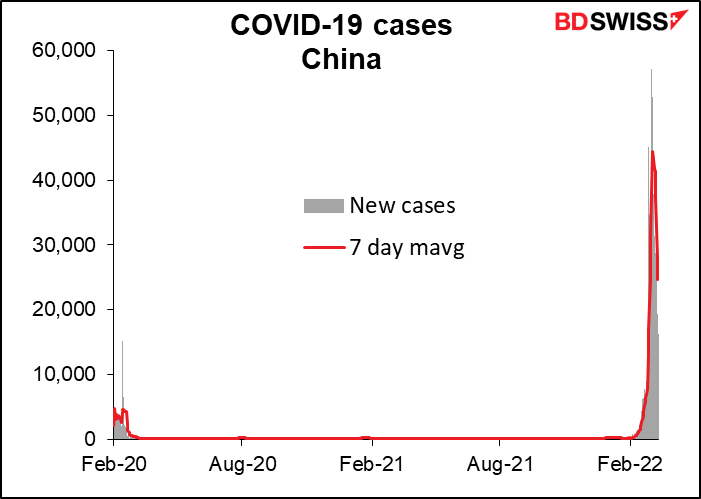
Secondly, a resurgence in the virus, particularly in China, which is the biggest importer of oil in the world. You may have forgotten all about the virus while worrying about whether WWIII has already begun, but the virus hasn’t forgotten about you!
I mentioned the surge in China yesterday and the lockdown measures in the industrial city of Shenzhen that will severely curtail the supply of electronics products worldwide.
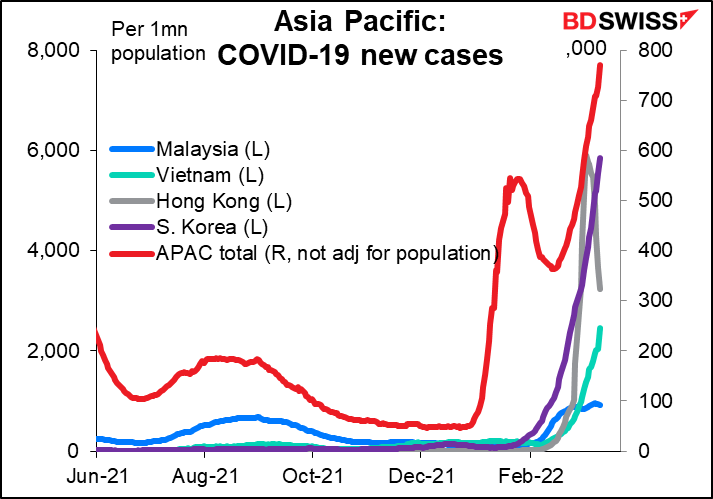
It’s not just China, either. Other Asian countries that managed to keep things under control up to now are seeing an explosion of cases. This could be a problem too – remember how a lack of workers in Malaysia hit semiconductor manufacturing there with knock-on effects to auto production everywhere else in the world? What impact will this surge in cases in South Korea have? They make a lot of semiconductors, memories and monitors in South Korea.
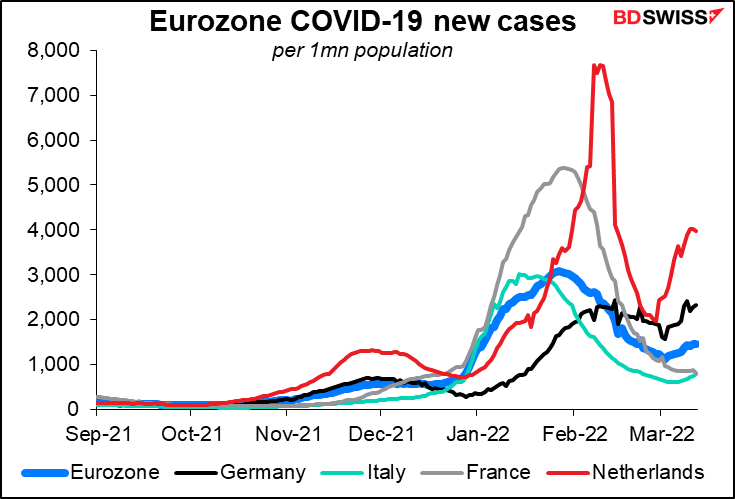
Cases in the Eurozone have started to turn up again too.
I don’t usually do technical analysis, but I noticed that the Hang Seng index has decisively broken a 30-year trendline.
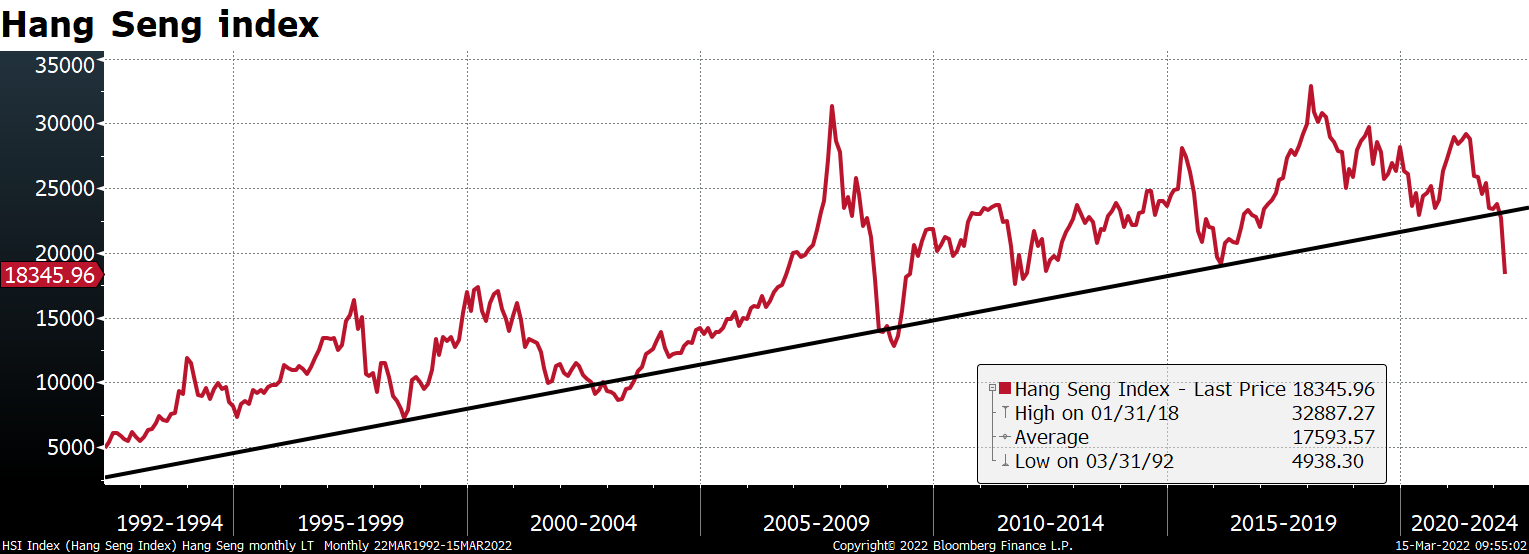
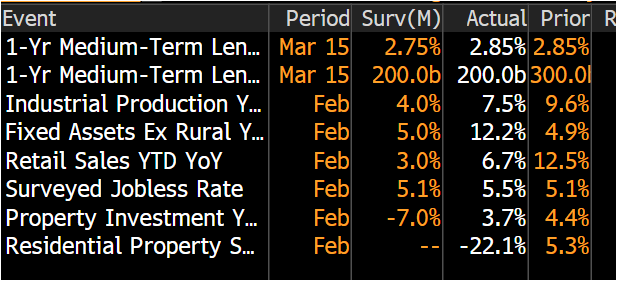
This is despite better-than-expected China data this morning. This could be worrisome.
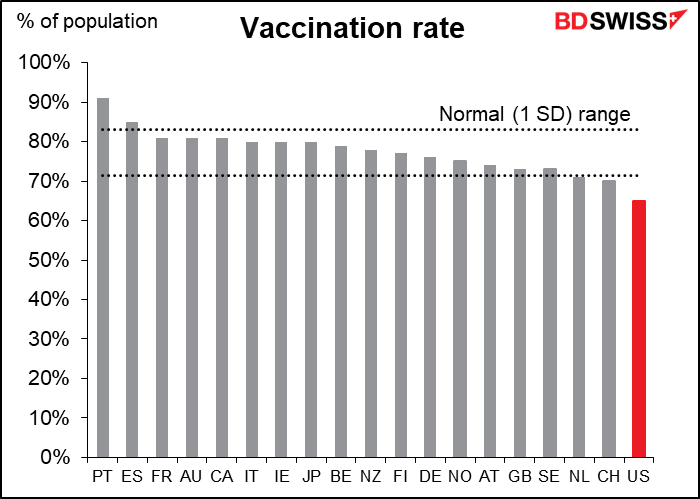
Cases in the US have been coming down, fortunately. But I suspect this is only a temporary lull because the US has the lowest vaccination rate of any major country. [I make no editorial comment on this subject because I know my Gentle Readers may well have a variety of views on this subject. I will only say that I have had my shots and a booster and still wear a mask everywhere, even in the shower and when I go to bed. (Not quite! Just joking. But almost.)]
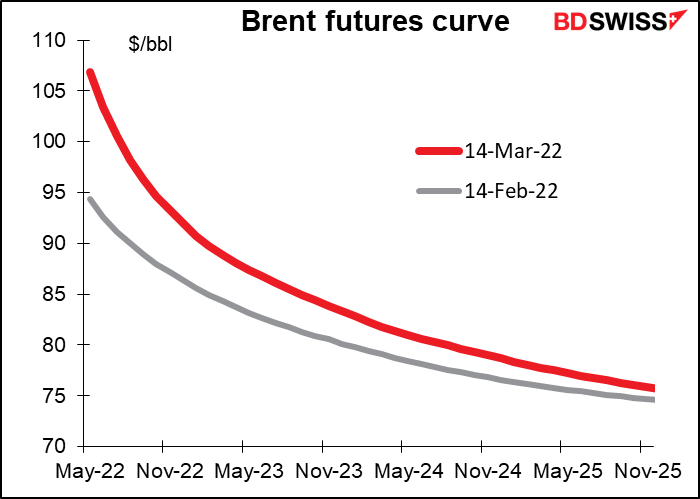
In any case, OPEC and others have been pointing out that at the moment there is no shortage of oil, just the fear of a shortage of oil in the future. The price of oil further out in the future isn’t that different than it was a month ago.
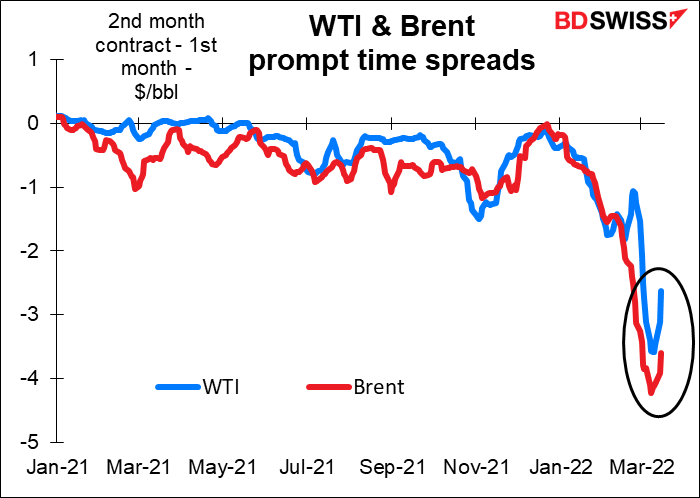
And the prompt time spread – the premium that people are willing to pay to get oil one month earlier – has started to shrink over the last few days, meaning the panic has started to subside.
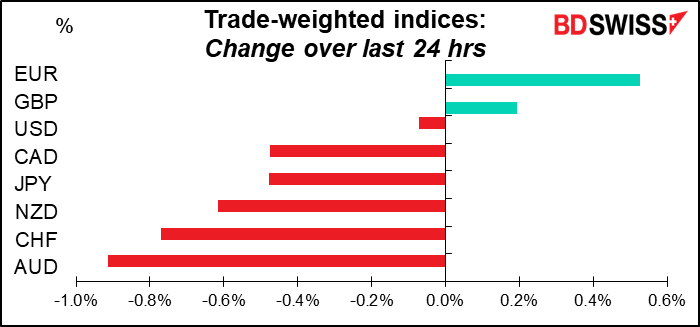
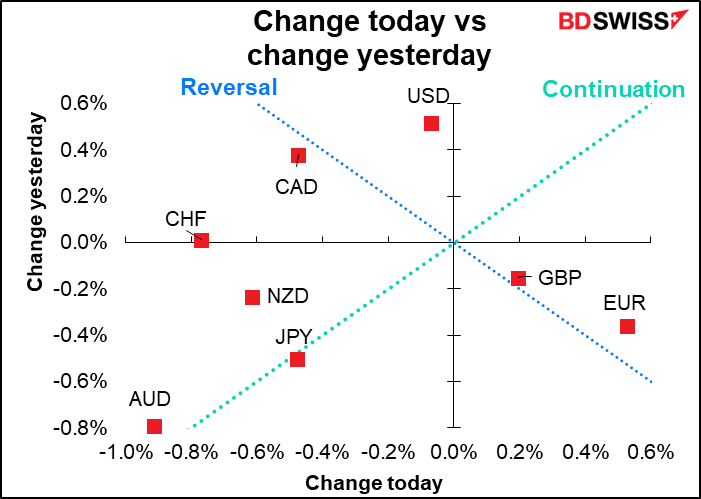
There was also some relief that talks between Russia and Ukraine continue. Ukraine President Zelenskyy (this is how he spells it on his Twitter account) yesterday said the fourth day of negotiations had been “pretty good” and further talks are planned for today. That probably explains EUR strength and the weakeness of the safe-haven currencies.
Today’s market
Note: The table above is updated before publication with the latest consensus forecasts. However, the text & charts are prepared ahead of time. Therefore there can be discrepancies between the forecasts given in the table above and in the text & charts.
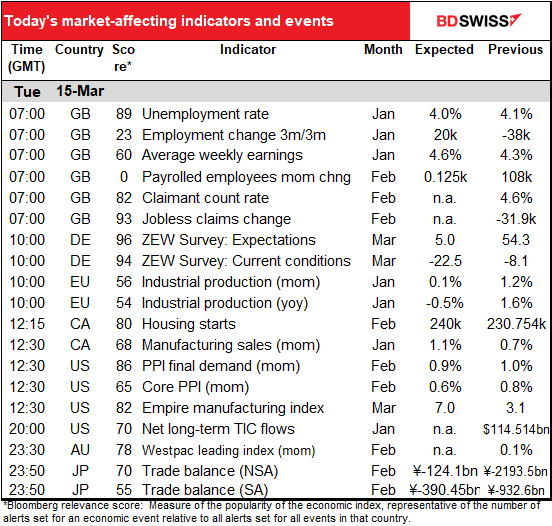
The European day kicks off with the UK employment data, which I went over yesterday. It was better than expected all around. In particular, payrolled employees rose by more than double the market forecast, the unemployment rate was lower than expected, and average earnings rose by more than expected. A bullish background for this week’s Bank of England meeting. GBP
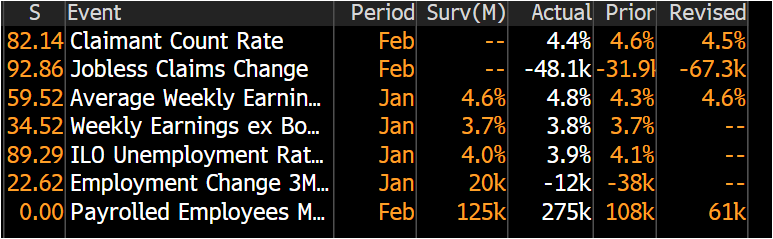
The ZEW survey of economists, analysts and other parasites on working members of society is expected to collapse. The current conditions index is bad enough (forecast to be down 14.4 points from the previous month) but the expectations index is pitiful! It’s forecast to fall 49.3 points. There is however a tremendous range of forecasts – from -40 to 28. This is no doubt a function of the war in Ukraine and the likely impact of German moves to become independent of Russia’s energy supplies, which will take a severe toll on the average German.
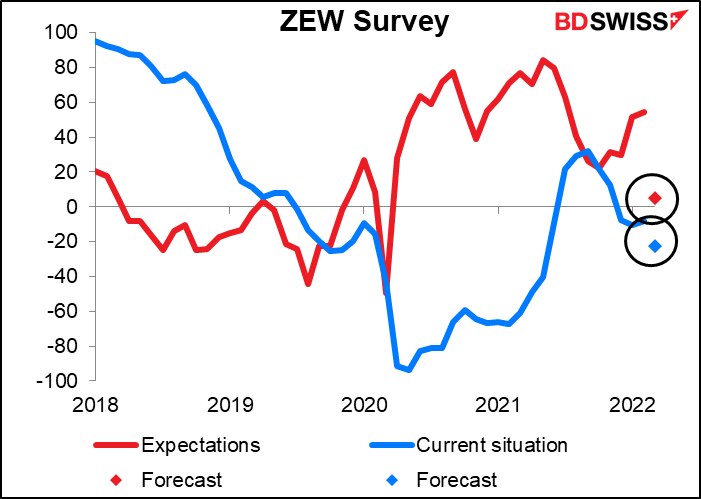
Speaking of which, EU-wide industrial production is expected to eke out only a small gain of 0.1% mom in January. This highlights the fragile nature of the EU recovery before the war started. It may also be related to the virus figures shown above.
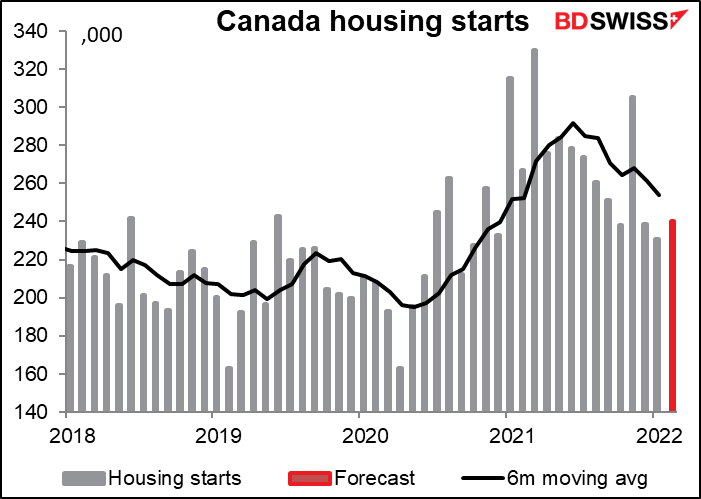
Canadian housing starts are expected to rise in February as permit issuance has been fairly strong. However labor shortages are preventing starts from rising as much as permits. In any case, an upturn here could be positive for CAD.
US producer prices are expected to move up a notch. Do we really need any more confirmation that US inflation is rising? In any event this is likely to be just one more reason for the Fed to turn hawkish at the two-day meeting that starts today.
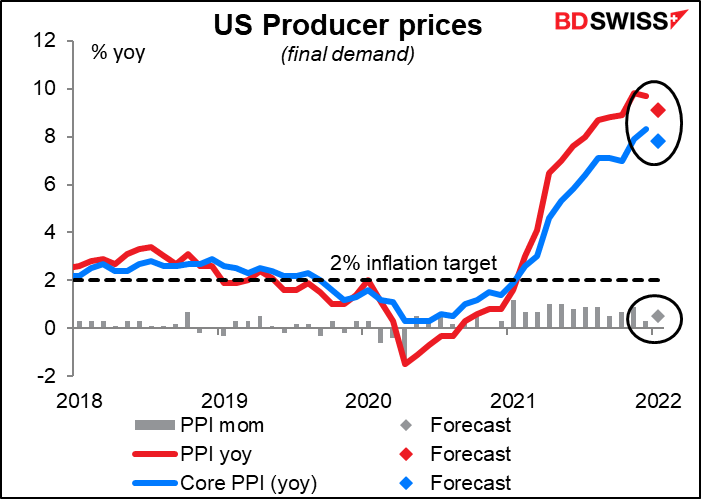
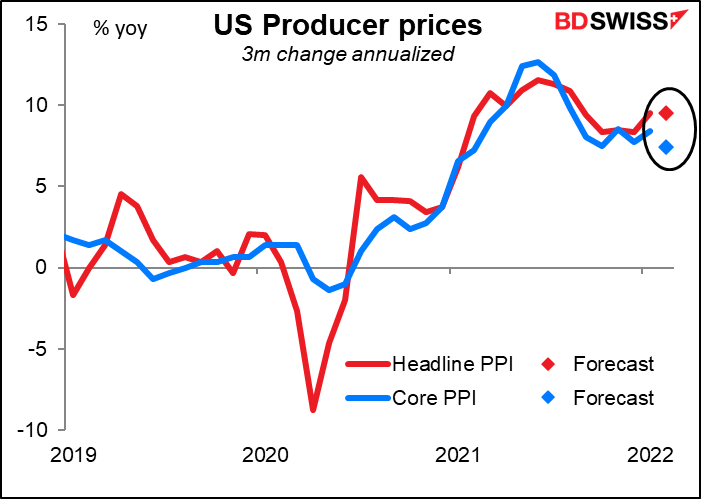
There is one good sign expected – the three-month annualized rate of change of core inflation is forecast to slow a bit. Could this be the beginning of a slowdown in core inflation? Alas, I doubt it. Higher energy prices will gradually start to work their way through the system, pushing up core prices as well.
For a discussion about the relationship between producer prices and consumer prices, see The PPI and the CPI: what’s the connection?
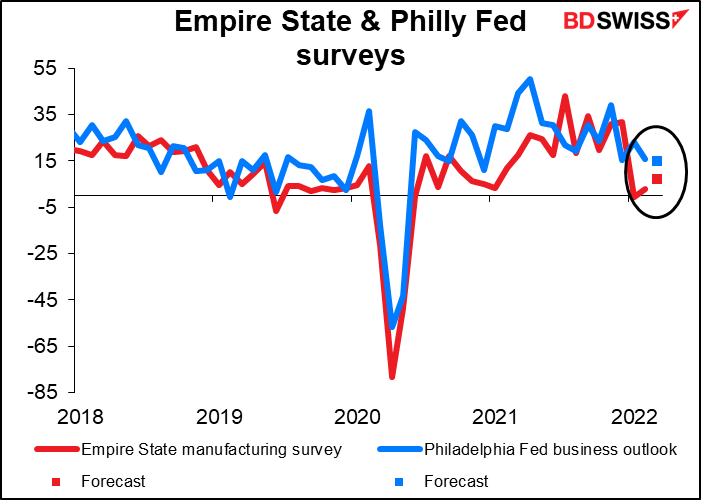
The Empire State manufacturing survey is expected to rise a bit while Thursday’s Philadelphia Fed business outlook survey is expected to fall a bit. My impression is that every month economists forecast that these two will converge somewhat. In any case, they’re both expected to remain in expansionary territory, which would be a good sign for the US economy and be positive for the dollar. The Atlanta Fed’s GDPNowcast estimate also predicts some growth in the US economy in Q1 – 0.5% qoq SAAR.
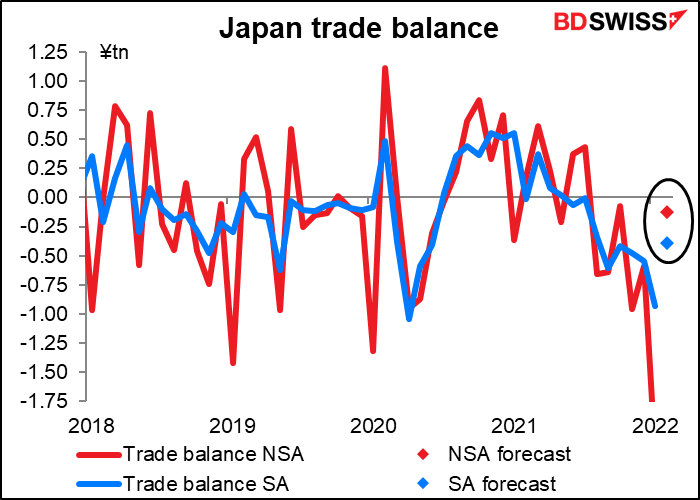
Overnight we get Japan’s trade data, which doesn’t have that high a Bloomberg relevance score but I still think is important for JPY. The trade deficit is expected to narrow significantly on both a seasonally adjusted and NSA basis. This may be somewhat positive for JPY, although I think risk sentiment is probably more important at this time.
Source: BDSwiss