Rates as of 04:00 GMT
Market Recap
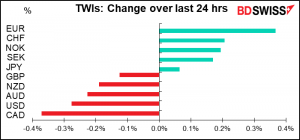
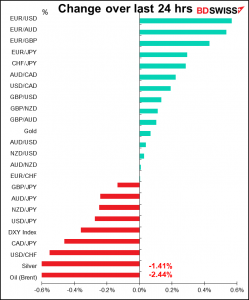
It was Europe day in the FX market yesterday. I’ve added NOK and SEK to the trade-weighted indices table today to make this point – the four major European currencies were the four best-performing ones. Part of this was just USD weakness as US bond yields fell more than bond yields elsewhere.
Part though may have been enthusiasm for the EU as the EU’s various rescue plans overcame some potential hurdles: Finland’s parliament approved the EUR 750bn EU rescue fund, making 19 of the 27 countries that have now approved it. Also Germany’s constitutional court rejected a case against the European Central Bank (ECB)’s Public Sector Purchase Program (PSPP), the ECB’s EUR 2.4tn flagship bond-buying program. And ECB Governing Council member and Banque du France President Villeroy de Galhau said the French economy would grow “at least” 5.5% this year. (He also said there’s no risk of a return of lasting inflation in the euro area” and so ECB policy “will remain very accommodative for a long time,” but that part wasn’t so important, probably because everyone’s policy will remain accommodative for a long time.)
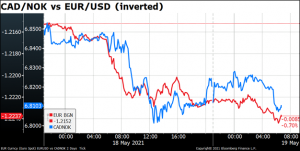
If we look at the change in CHF and SEK vs EUR, we can see that they were virtually unchanged on the day. That suggests the main move was EUR/USD, and it’s not clear whether it was EUR strength or USD weakness.
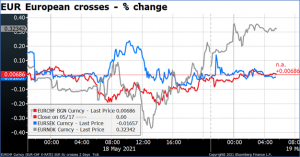
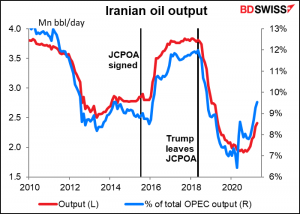
Note though that NOK (grey line) did weaken significantly vs EUR. This was because of comments by Russia’s representative at the UN International Atomic Energy Agency that the US and Iran have made “significant progress” on reviving a deal restricting the OPEC country’s nuclear weapons development. An agreement would allow Iran to resume oil exports, which would boost supply – Iranian output is currently some 1.4mn barrels a day (b/d) below where it was after the Joint Comprehensive Plan of Action (JCPOA), the agreement restricting Iran’s nuclear ambitions, was signed. Oil fell on the news.
Later he backed off from his earlier statement and oil bounced from the lows, but it was unable to sustain the rally and has since resumed its fall.

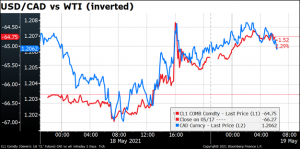
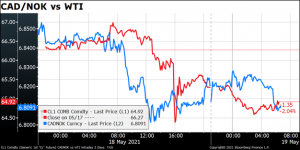
The fall in oil also explains the fall in CAD. USD/CAD (blue line) was declining – i.e., CAD was strengthening – then oil (red line) started its fall (inverted in this graph) and USD/CAD followed along in almost lock-step.
I was surprised that CAD fell more than NOK. USD/NOK has a slightly higher correlation to the price of oil than USD/CAD does, which is appropriate given the Norwegian economy’s much greater reliance on oil.
Looking at the timing though, the decline in CAD/NOK started before the decline in oil and wasn’t that closely related.
It’s clear NOK was boosted by the strength in EUR.
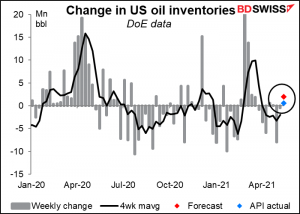
I think oil may be in for some recovery in oil prices today, though. The American Petroleum Institute (API) announced a smaller-than-expected build in oil inventories of only 620k barrels. The market is looking for tonight’s US Dept of Energy announcement to be a build of around 2mn barrels. If it comes out below expectations, oil could recover a bit, bringing CAD and NOK with it.
Today’s market
Note: The table above is updated before publication with the latest consensus forecasts. However, the text & charts are prepared ahead of time. Therefore, there can be discrepancies between the forecasts given in the table above and in the text & charts.
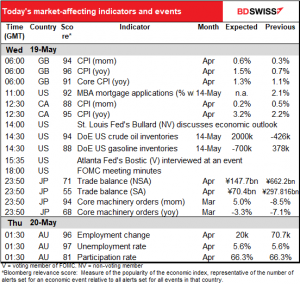
This morning we had the UK consumer price index (CPI). It rose exactly in line with expectations. This could be good for GBP as it may encourage speculation about the Bank of England turning to a tightening bias.
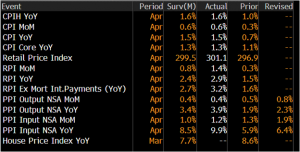
Next up is the Canadian CPI. As you can see, it’s expected to leap from 2.2% yoy – right at the Bank of Canada’s target – to 3.1% yoy, outside the Bank’s target range.
The above-target inflation rate could spark thoughts that the Bank of Canada might start normalizing policy soon, which would be positive for CAD.
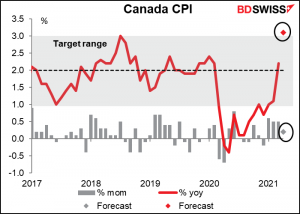
However, I don’t think this figure is going to set off alarm bells in the Bank of Canada. First off, note the mom change – it’s forecast to be a modest 0.2%, below the rate of the previous three months. So, it looks like inflation is slowing, not accelerating. The problem is that a year ago, it was -0.7% mom, so the dreaded “base effect” that everyone is talking about is kicking in.
Secondly, although the inflation target in Canada is expressed in terms of CPI inflation, the Bank notes that
“many other factors can influence total CPI inflation (for example, changes in the prices of commodities set in global markets, movements in the Canadian dollar, sector-specific developments and changes in indirect taxes). The Bank “looks through” the temporary effects of these other factors on inflation when making its policy decisions because the related price movements are likely to be short-lived and monetary policy affects inflation with a lag. The Bank does this…by looking at measures of core inflation as operational guides to policy…”. (emphasis added).
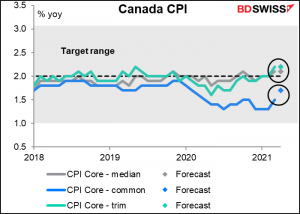
What’s happening with these core measures? They’re pretty steady. Two of the three are expected to be unchanged, while the core–common is expected to be slightly higher. All are almost right on the 2% CPI target. So, if the Bank were actually using these as “operational guides to policy,” they would think that inflation is where they want it to be and therefore policy is just about right.
We can also see from the graph that these “operational guides” have never been outside the 1%-3% target range and yet the BoC has engineered among the most dramatic easing of policy of all the major central banks (expanding its balance sheet some 5x from pre-pandemic level). Inflation evidently isn’t the only thing on their mind.
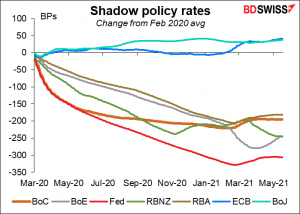
This graph shows the change in “shadow policy rates” of each central bank compared to the average for Feb. 2020. (“Shadow policy rates” are the effective policy rate taking into account all extraordinary measures, such as quantitative easing. They’re a way of quantifying the total easing measures of a central bank once the policy rate has gotten down to zero and the bank starts relying on other measures besides rates alone.) Note that Canada was one of the two most aggressive central banks early on, tied w. the Fed. That happened while the headline CPI was falling through the floor, but the core measures were relatively steady – proving that the core measures are a better gauge of the trend in inflation, since here we are a little over a year later and everyone is worried about too-high inflation. The point is, the BoC ignored them when inflation was falling; will it also ignore them when inflation is rising?
Next up are the minutes of the April 28th meeting of the Federal Open Market Committee (FOMC). I went into this in some detail in my Weekly Outlook, so just to repeat the key point here: Given the number of Committee members we’ve heard from on the important issues recently, and also given how conditions have changed in the 21 days between the meeting and the minutes’ release – the April nonfarm payrolls and CPI shocks, specifically –these minutes are now rather dated and won’t be particularly informative.
A couple of important indicators out from Japan overnight.
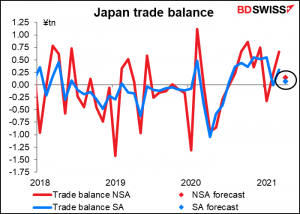
The trade balance is expected to be in surplus on both a seasonally adjusted & unadjusted basis, although smaller than last month in both cases. This worrisome after Q1 GDP came in weaker than expected; it suggests Q2 isn’t starting out all that strong. This is rather depressing considering that many of Japan’s export markets were recovering in April and therefore one might’ve expected exports to do better than this.
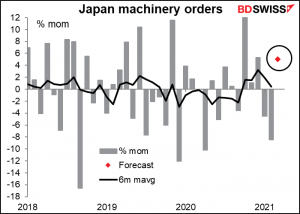
Machinery orders are expected to rebound after two down months. However, it’s expected to be a rather tepid rebound; the forecast 5.0% mom rise wouldn’t even be enough to offset the previous month’s -8.5% mom fall. The problem is that non-manufacturers are still struggling in Japan and aren’t buying much equipment.
These two indicators combined might turn out to be negative for Tokyo stocks, which could promote a domestic “risk-off” environment that would be positive for the yen. Maybe.
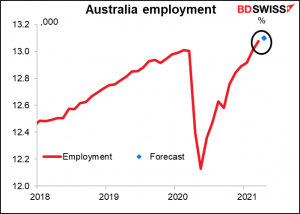
Finally, Australia employment data is a biggie for that country. The Reserve Bank of Australia said last December that “The Board views addressing the high rate of unemployment as an important national priority.”
On the one hand, Australia is one of the few countries where employment has returned to the pre-pandemic level.
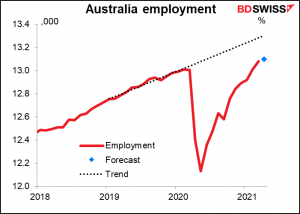
On the other hand, just like in the US, it was growing before the pandemic, so it’s still not where it would’ve been if there hadn’t been a pandemic at all.
As for this month, the rise in employment is expected to be the smallest in seven months…
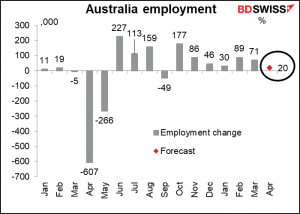
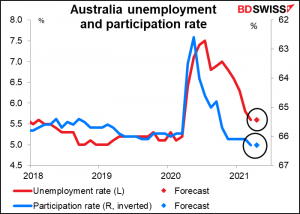
…while no improvement at all is expected for the unemployment rate or the participation rate. I think the RBA would find these figures disappointing. They might be enough to keep them committed to holding policy steady, which would be negative for AUD.
Source: BDSwiss