Rates as of 05:00 GMT
Market Recap
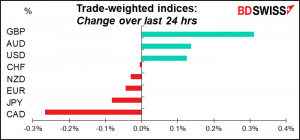
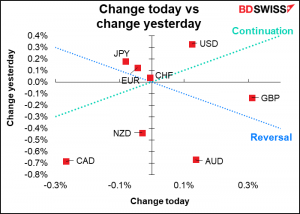
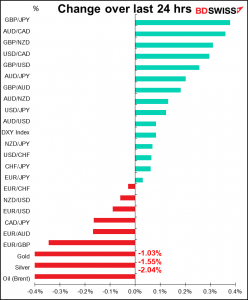
Calm before the storm? Not much movement in currency rates over the last 24 hours. I consider a movement of ±0.1% to be just “Brownian motion” in the FX market and not worth discussing or explaining. Currency rates move constantly, often for reasons that only a few market participants might really know, e.g. a big insurance company repatriating some money or an importer paying a bill. Day-to-day stuff like that. It’s not necessary to look for any deep or profound explanation for a move of ±0.1% or even ±0.2% sometimes.
So that leaves us with two questions: why was GBP up and why was CAD down?
GBP is a unlikely one, given that the country is on the verge of being overwhelmed by the Omicron variant. It’s because of yesterday’s rise in employment. While yesterday’s figures as I saw them were OK but not stunning – the unemployment rate fell to 4.2% from 4.3% in line with expectations — there was one statistic that I don’t have access to: the number of employees on payroll rose by 257.3k in November, the most on record. That seemingly encouraged investors, who got a further frisson this morning when inflation rose faster than expected. Inflation was supposed to peak at around 5% in Q1 next yr but here it is November and it’s already over 5%. If you look down the table you’ll see every inflation measure was higher than expected.
Under normal circumstances there’d be no question but that the Bank of England would be hiking at its meeting tomorrow. (Actually the meeting is today and they just announce the results tomorrow, but that’s a technicality.) I’d expect them to make it clear that the hike is only delayed, not shelved.

Among the other “not normal” circumstances in the UK is that almost 100 Conservative Party members of Parliament (MPs) yesterday voted against PM Boorish Johnson’s bill to mandate the use of Covid passes at nightclubs and other venues, forcing him to rely on Labour Party votes to pass the measure. This was the biggest rebellion against the PM yet. He’ll probably catch more flack tomorrow too after the Conservatives lose what would normally be a safe seat in the twee parliamentary seat of North Shropshire, home of the Shropshire Lad’s descendants, who are upset that the PM and his cabal were partying hearty last Christmas while forcing everyone else in the country to abstain from merriment.)
I remain bearish GBP as I think the domestic politics Brexit disruptions are a poisonous mix. Ousting Johnson could ultimately be good for the country and the government, except a) the markets don’t like uncertainty, and b) there’s no guarantee that the next PM would be better.
As for CAD, the explanation there is easy. It’s the same graph I show almost every other day:
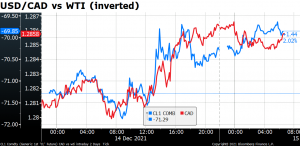
So then we have to ask, why was oil down so much? You guessed it – fears of the impact of the Omicron variant on demand. There are particular fears about Chinese demand as the country imposes more virus-related restrictions, not to mention anti-pollution measures. China is the largest buyer of internationally traded oil so its activity has an outsized impact on the oil market.
The prompt time spread, the difference between the second futures contract and the first (in this case, February minus January), has almost disappeared. This is a measure of traders’ desperation – how much extra are they willing to pay to get oil ASAP rather than waiting an extra month. The shrinking of this premium for ASAP delivery means that the deficit in the oil market is disappearing. That’s negative for prices and negative for CAD.
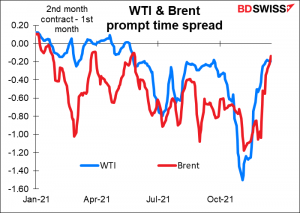
As I’ve said before, I think the situation is likely to improve next year if the Omicron variant proves not to be as disruptive as people fear. But then again I’m no doctor, so what I have to say on this matter isn’t statistically significant.
By the way, you can now breathe easy again: the US Congress passed a measure to increase the debt ceiling by $2.5tn, which will take it past next year’s midterm elections. Then the Republicans will probably have a majority in Congress. Let’s see if they vote to default when they’re in power. Hah! You know they only act like this when they can evade responsibility for their actions and blame everything on the Democrats. They’re cosplayers, not politicians governing.
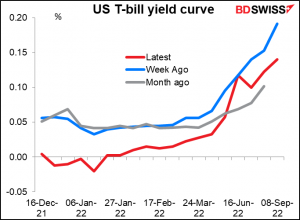
We now have a nice normal T-bill yield curve as a result, finally.
Today’s market
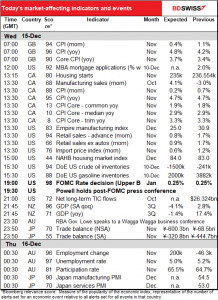
Note: The table above is updated before publication with the latest consensus forecasts. However, the text & charts are prepared ahead of time. Therefore there can be discrepancies between the forecasts given in the table above and in the text & charts.
A big day today. The main event is the meeting of the Federal Open Market Committee (FOMC), the rate-setting body of the US central banks, followed by a press conference by Fed Chair Powell. I went over this in my usual depth and detail in my Weekly Outlook: A Busy End of the Year, which you can read at your leisure if you care. The highlights are:
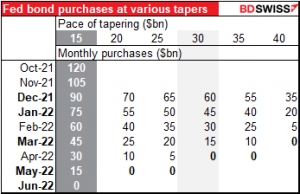
The main issue is how fast to taper down their bond purchases. They were buying $120bn of bonds a month but decided last month to cut that by $15bn a month, thereby ending the purchases in June, enough time to start hiking rates then or in July. With inflation out of control and unemployment near previous lows, they’re going to discuss speeding up the tapering process so that they can then start hiking rates earlier.
This table shows what the monthly tapers would be at various paces. I think the market is assuming that they double the pace to $30bn a month, which would end the bond purchases by March. Then they could start hiking rates – “lift-off” – at the May meeting, or even March perhaps.
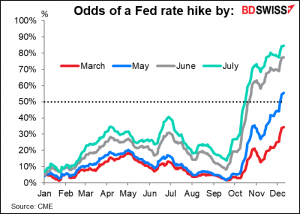
May is now seen as a better-than-50-50 proposition, while March is moving up rapidly.
Increasing the pace of tapering to less than $30bn a month would probably be negative for USD, while increasing it by more would most likely be positive.
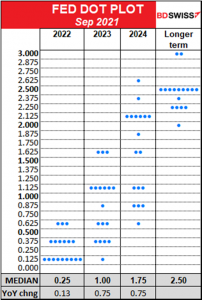
The other focus of attention will be the renowned dot plot, in which each Committee member says where he or she thinks the fed funds rate is likely to be at the end of the year. The market is expecting 2022 to be revised up to show two rate hikes and for 2023 and 2024 to continue to show three hikes each, leaving the fed funds rate at 2.25% at the end of this hiking cycle (as far as we know). Less than that would be negative for the dollar, more would be positive.
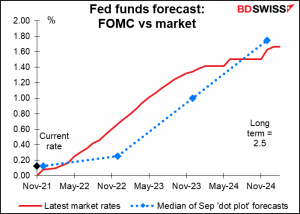
This is more aggressive than the market now, which sees rates topping out at 1.5% or 1.75%. (In fact the fed funds futures market goes out to Nov. 2026, which is priced at 1.99%)
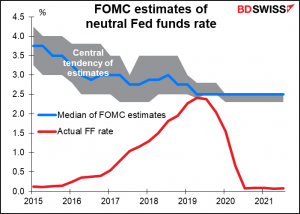
The Committee’s estimate of the “neutral” rate for fed funds is 2.5%, so bringing it back to 2.25% would still be slightly accommodative. And don’t’ forget, the last time inflation was this high, the fed funds rate was 14.15%!!!
There’s also the question of what the statement following the meeting will say and what Fed Chair Powell will say in his press conference. I don’t expect the word “transitory” to appear in the statement following the meeting, but it’s likely to continue to argue that inflation will slow down in the future. Powell is likely to say that the “flexible average inflation targeting” criterion of “inflation moderately above 2 percent for some time” has been met, leaving the decision of when to start hiking rates entirely on when they’ve achieved “maximum employment.” Note that in his recent comments to Congress, Powell argued that “stable prices” were a necessary condition for achieving “maximum employment,” so they could start hiking rates before the US gets back to 3.5% unemployment.
The question of when “lift-off” will occur is likely to dominate the press conference. Chair Powell is unlikely to give a specific date, he’ll no doubt make it clear that members believe an earlier increase in rates is likely to be warranted. The dot plot should make that clear as well.
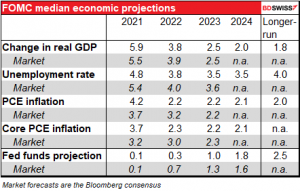
It will also be important to see how the Fed’s other economic forecasts have changed.
That would be enough excitement for most days. But in fact there’s a pretty packed schedule aside from the Fed.
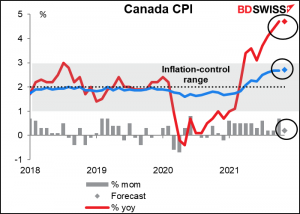
Canada’s consumer price index (CPI) is expected to be unchanged in November. (More accurately, the year-on-year rate of change of Canada’s CPI is expected to be unchanged, but you know what I mean.) That’s pretty good, eh? considering that the US CPI was up 0.6 percentage point in the month. Has Canada’s inflation peaked?
Even if it has, it’s still too high. The Government and the Bank of Canada Monday renewed the Bank’s Monetary Policy Framework for another five years. While they added several nods to the labor market in lines that Fed Chair Powell could’ve written himself (“a strong and inclusive labour market helps reduce income inequality…”) they stopped short of declaring a full “dual mandate.” “The primary objective of monetary policy is to maintain low, stable inflation over time,” the statement said. So with inflation running more than double the “inflation target,” which is “the 2 percent mid-point of the 1 to 3 percent inflation-control range,” they’d better get on their horses and ride.
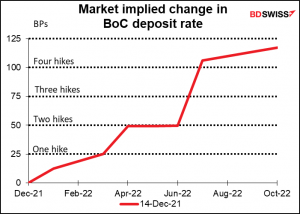
The market assumes the first rate hike will come in March, in line with the Bank’s comment at its last meeting that its 2% inflation target would probably be “sustainably achieved…sometime in the middle quarters of 2022.”
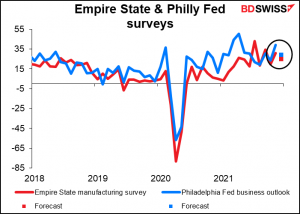
The Empire State manufacturing survey is expected to be down, as is Thursday’s Philadelphia Fed business survey. But “down” is a relative word – more like “sideways within the recent trend.” Accordingly I don’t think this will matter very much, not 7 1/2 hours before the FOMC meeting finishes.
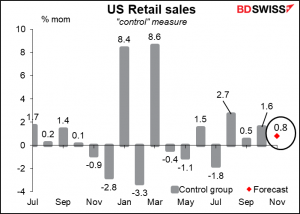
US retail sales is another story though – that would be the big item on today’s sked if it weren’t for the Fed. (Or so I’ve read.) The figure is likely to be dampened by weak auto sales, which have been constrained by chip shortages. On the other hand, new car prices rose 1.1% mom in the November CPI report, which could make up for some of the loss of volume.
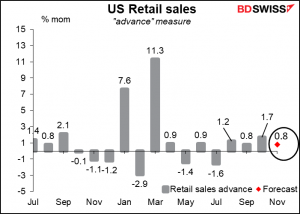
The “control” measure, which feeds into the GDP report, is expected to show the same healthy rise. A solid retail sales report is likely to be positive for the dollar.
Then we just wait for the FOMC…
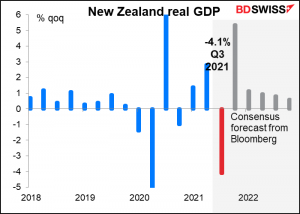
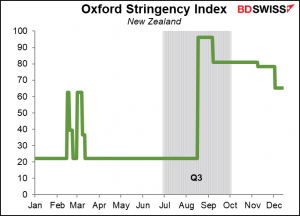
After that, the next bit of excitement is the New Zealand Q3 GDP. New Zealand is always the last of the G10 countries to release its GDP. I don’t think there will be that much excitement around the figure; it’ll be disastrous, but everyone knows a country in near-complete lockdown isn’t going to be booming. It’s the size of the rebound in Q4 that people want to know.
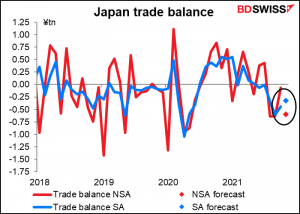
Japan’s trade deficit is expected to widen on a not-seasonally-adjusted basis but narrow on a seasonally adjusted basis. Does anyone care? Probably not. But I do.
Australia employment is a different matter though as many people care about that since Australia is a “dual mandate” country whose central bank is required to aim at both “the stability of the currency” and “the maintenance of full employment.”
The market is going for a doozy of a figure this month – the biggest increase in employment since June of last year.
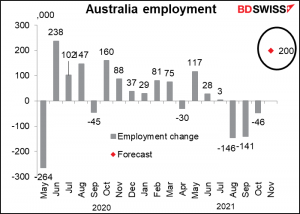
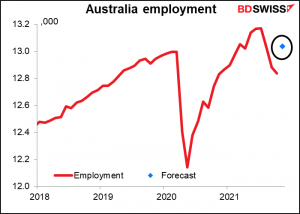
This follows three months of declines so still leaves total employment below its recent peak. Nonetheless it’s expected to be above where it was before the pandemic, which is unusual.
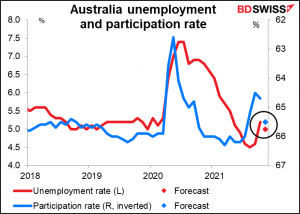
The unemployment rate is expected to fall and the participation rate to rise nicely.
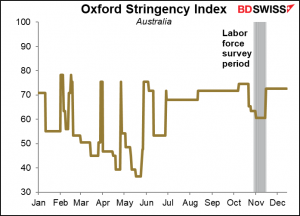
The improvement is to be expected, as the survey period ran from Oct. 31st to Nov. 13th, just during the period when lockdown measures were easing. We’ll have to wait till next month to see how long these jobs last.
Source: BDSwiss