Note: The table above is updated before publication with the latest consensus forecasts. However, the text & charts are prepared ahead of time. Therefore there can be discrepancies between the forecasts given in the table above and in the text & charts.
Rates as of 05:00 GMT
Market Recap
Once again the action was in the bond market, not the stock market. US stocks closed modestly lower, with the S&P 500 again effectively unchanged and NASDAQ down 0.6%. In Asia this morning most markets are down, with several off more than 1%.
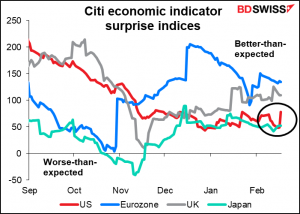
Meanwhile, the recent rise in yields globally reversed slightly yesterday despite better-than-expected data from:
● Japan: machinery orders up 5.2% mom instead of down 6.1% mom as expected, while the Reuters tankan showed sentiment among Japanese manufacturers turned positive in February for the first time since July 2019;
● the US: retail sales soared 5.3% mom vs 1.1% expected while producer prices jumped 1.3% mom vs 0.4% expected; and
● Canada: headline CPI 1.0% yoy vs 0.9% yoy expected, up from 0.7% previously.
Yield curves have been steepening so far this year, but yesterday there was a trend of “bull flattening” – the yield curve flattening because of longer-dated yields coming down. (There can also be “bear flattening,” when the yield curve flattens through shorter-dated yields moving higher.)
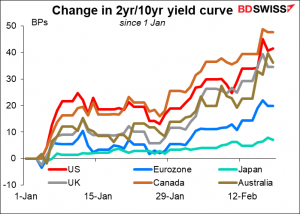
What might have caused the reversal? Why would rates have fallen in response to better-than-expected economic news? It could be that the rise in yields in recent days has slowly started to dawn on investors and begun to dampen their appetite for risky assets, such as stocks and commodities. The stronger-than-expected data may then have trigged a “risk-off” move that pushed bond yields lower – temporarily, in my view.
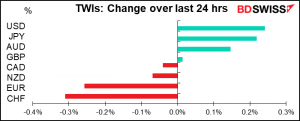
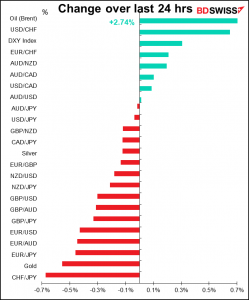
The FX market was full of odd movements.
USD gained even though both US real and nominal yields fell and 10yr US breakevens were unable to sustain the break above 2.25%. The positive surprise in US retail sales was probably powering the dollar higher. The counterpart of USD strength was EUR weakness.
If the apparent resilience in the US economy was behind the move higher in USD, I would’ve expected the commodity currencies to have outperformed too, and for JPY to have weakened. USD/JPY did briefly poke its nose over 106.00 yesterday as Tokyo stocks rallied, but this morning it’s trading almost exactly where it was yesterday morning this time(105.86 vs 105.90).
The weakness in CAD was particularly surprising against the background of a further climb in oil prices and relatively steady Canadian bond yields. Oil gained on news of a reduction in US output and another drawdown in inventories according to the American Petroleum Institute (API) (see below). This is despite a Wall Street Journal article saying that because oil prices have recovered, Saudi Arabia will announce at the March 4th OPEC meeting that it’s going to reverse its unilateral 1mn barrel-a-day oil production cut starting in April. I think we could see a rebound in CAD today.
CHF has not been following the usual “risk-on, risk-off” trend recently. It’s unusual that USD and JPY would be top of today’s performance chart, a clear “risk-off” signal for the FX market, while CHF was at the bottom, which would usually be a result of “risk-on.” But then again there are always “supernatural forces” at work in this pair that may not be visible to the naked eye.
Today’s market
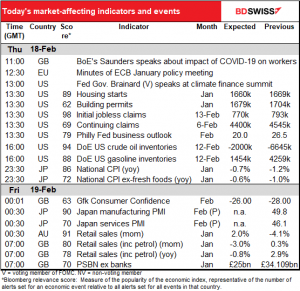
The main focus this morning will be the Accounts from the January European Central Bank (ECB) meeting. The meeting surprised ECB-watchers by moving a few lines* that had been buried in the sixth paragraph of the statement at the December press conference into the Policy Statement released immediately after the January meeting, thus emphasizing its importance. The statement basically said that the purpose of the EUR 1.85tn Pandemic Emergency Purchase Programme (PEPP) is to create “favourable financing conditions” and that if they can meet that goal without using up all the money in the fund, then great. If they need more money to accomplish that goal, that’s cool too. In any case, they’re not going to cut down on their buying until they’re convinced that the impact of the pandemic is no longer depressing inflation.
This change in emphasis has raised some questions about whether the ECB would react differently now to a change in inflation compared to how it would’ve reacted before – to a change in its reaction function with regards to inflation. This will be one of the main points that people will be looking for in the minutes – what caused them to emphasize the symmetrical nature of the PEPP.
“The part in question was: “The purchases under the PEPP will be conducted to preserve favourable financing conditions over the pandemic period. If favourable financing conditions can be maintained with asset purchase flows that do not exhaust the envelope over the net purchase horizon of the PEPP, the envelope need not be used in full. Equally, the envelope can be recalibrated if required to maintain favourable financing conditions to help counter the negative pandemic shock to the path of inflation.”
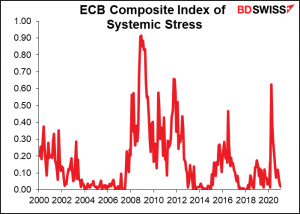
In any case, the ECB must be doing something right – its Composite Indicator of Systemic Stress (CISS) is at 0.013. According to the ECB, this indicator is calculated using 15 mainly market-based financial stress measures: financial intermediaries, money markets, equity markets, bond markets and FX markets. All components are weighted equally so that the CISS places more weight on situations in which several markets are stressed at the same time. It’s calculated so that values range between zero and one, with the closer the values are to 1, the higher stress levels. In that case, the current level – pretty close to zero – must mean not much stress in the system. That means no need to “recalibrate” policy right now, which is positive for EUR.
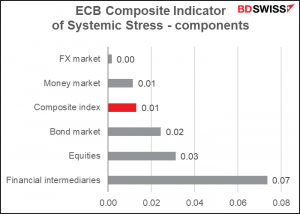
None of the five components are showing any particular stress. They’re all pretty close to zero, the least stressed possible (the index doesn’t go negative). While this doesn’t mean the ECB can relax, it means it doesn’t have to step up its aid to the market now.
The other thing that surprised ECB-watchers – well, surprised me at least – was that they still nattered on about the exchange rate even though the euro hadn’t appreciated at all since the December meeting (it was up a few pips vs USD but down a few pips on a trade-weighted basis). In the press conference, this is what ECB President Lagarde had to say on the subject:
On the strength of the euro, let me just tell you that we are monitoring very carefully exchange rates, very carefully, because we know that exchange rates have an impact on prices, and clearly play a part in our inflation forecast, and what we can deliver with our monetary policy. So, we are very attentive, and as I said earlier on, all instruments can be adjusted and nothing is off the table.
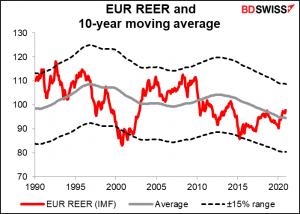
This concern of theirs drives me crazy, because the sad fact is that the euro isn’t particularly strong – it’s just stronger than it was a while ago. If we look at the euro’s real effective exchange rate (REEF), the inflation-adjusted value of the euro vs the Eurozone’s major trading partners, we can see that it’s almost exactly at the average level that it’s been for the last 10 years. OK, it’s higher than it was a few months ago, and 14% higher than it was at the bottom of the cycle back in April of 2015, but that doesn’t mean the earlier level was the “correct” level. That’s the behavioral finance market fallacy of anchoring, in which people get used to a certain level, begin to think of that level as “normal,” and anchor their expectations around it. The current level of the euro is a “normal” level for the currency.
In fact, it might be a bit cheap. According to the OECD’s way of calculating “fair value” for exchange rates, the euro is around 14% undervalued vs USD and 14% overvalued vs GBP –
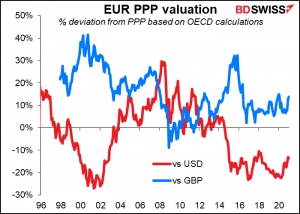
Furthermore, their own research shows that a change in the value of the euro is “barely noticeable” in the prices of most consumer goods. (“Generally, a simultaneous co-movement of the nominal effective exchange rate and prices is strong in the case of import prices, much weaker in the case of the producer price index (PPI) and barely noticeable for the consumer prices of non-energy industrial goods.”) So I don’t see what they’re moaning about. But they are moaning and the market listens to their moans, so we can’t ignore them.
That’s probably more than you wanted to know about the ECB meeting, but in my first job I got paid by the word and old habits die hard.
Today’s indicators
Now let’s get down to business.
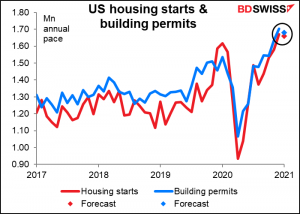
US housing starts and building permits are expected to be down a bit (-0.5% mom and -1.5% mom, respectively) but that’s really nothing, given that they’ve recently been the highest they’ve been since the housing market bubble of 2005/06.
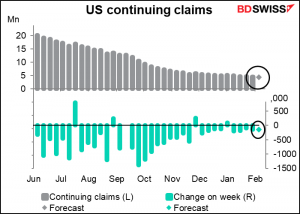
Then we get the dreaded weekly US jobless claims. They’re expected to fall by 23k, which would not be a million miles off of the -19k drop in the previous week. I think another slow fall like that might be disappointing to the market and cause yields to fall and the dollar with them, although it seems to me that the consensus forecasts are usually very wrong and the market moves more on the discrepancy between the forecast and the actual.
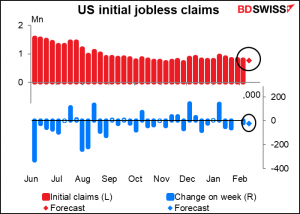
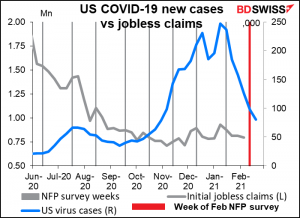
This week’s jobless claims are particularly significant because they correspond to the survey week for the February nonfarm payrolls.
The US does seem to have turned the corner on the virus. That may allow some jobs to come back and claims to fall.
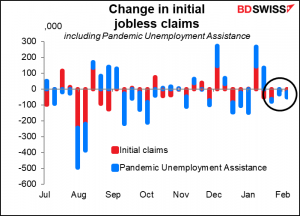
Of course, initial claims aren’t the whole story. Pandemic Unemployment Assistance (PUA) claims have been falling too. But oh so slowly!
Continuing claims are also expected to fall, although people don’t pay as much attention to them.
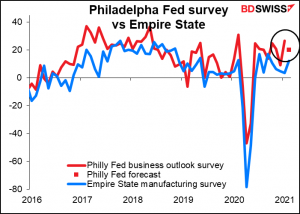
The Philadelphia Fed survey is expected to be down a bit, but the Empire State survey was expected to be up only a bit and in the event it rose sharply to 12.10 from 3.50, so we might get a surprise from Philadelphia too. In contrast to the expected mediocre improvement expected in jobless claims, a surprising beat on the Philly Fed index – like the beat on the Empire State index on Tuesday — might add to the “risk-on” sentiment and push Treasury yields higher, helping to boost the dollar too.
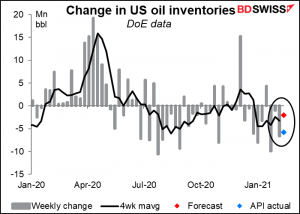
The US Department of Energy is expected to announce a 2mn barrel decline in crude oil inventories for the latest week. Yesterday though the American Petroleum Institute (API) announced a much larger 5.8mn bbl drawdown.
The New York Times carried the following map of the US. The dark blue is for places below 0 degrees Fahrenheit (-18 Celsius). That’s cold. The light blue is 0 to 32 F (0 C) while the orange is above 32 F (0 C). In other words, it’s below freezing in most of the US (although remember that most of the people live on the coasts and the center is relatively uninhabited.) I expect this cold snap to keep oil prices underpinned, which should be beneficial for CAD.
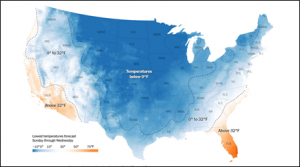
By the way, this map also helps explain why many hedge funds are moving to Florida, which coincidentally doesn’t have a state income tax.
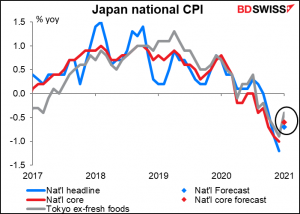
Then while we sleep soundly in our beds, Japan announces its national consumer price index (CPI). The inflation – or rather I should say the deflation – rate is expected to rise a bit, but remain in deflation. It doesn’t really matter, because a) it’s just following the Tokyo CPI, which was released as usual about two weeks ago, and b) we’re all just waiting to see the results of the Bank of Japan’s re-evaluation of its policy, which it said it would release at the March meeting Policy Board meeting (March 19th).
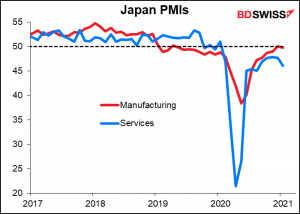
Then come the start of the February preliminary purchasing managers’ indices (PMIs) from the major industrial countries. There are never any forecasts for Japan, so we just have to wait to see what they are. The big thing would be if either of them poked their nose over the 50 “boom or bust” line. The manufacturing PMI hit that level in December but then fell back a bit in January. On the other hand, maybe they’ll fall back, especially the service-sector PMI. The Eco Watcher’s Survey current conditions index fell in January, not a good sign.
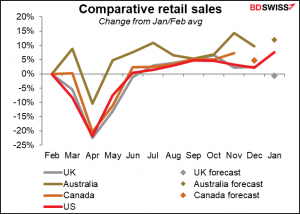
Then we get retail sales from Australia, followed a few hours later by retail sales from Britain.
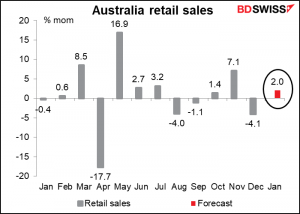
Australia’s retail sales were hit in December by changing seasonal patterns (thanks to the pandemic) and occasional lockdowns. A return to normality suggests a return to more normal sales, which may be positive for AUD.
The story is just the opposite for Britain, which went into a much more serious lockdown in January. Retail sales are expected to fall from the previous month, which makes sense as so many people couldn’t leave their houses (online shopping notwithstanding). The number of transactions on The Clearing House Automated Payments System (CHAPS), the UK’s money transfer system, fell 13% yoy during the month, while the CBI retail sales index fell to -50 from -3, indicating worsening conditions among retailers.
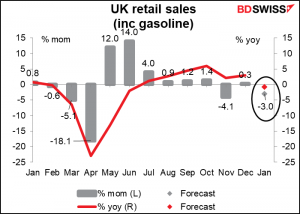
Compared to other countries releasing their retail sales this week, the UK is flagging while Canada is in line with the US. Australia, where the pandemic hasn’t been as severe as in other countries, is well above the US even after the blowout January figure from the US.
Even with the decline that’s expected for the UK in January, the value of retail sales there would be about the same as the pre-pandemic average. This shows the power of fiscal support.
Source: BDSwiss