Rates as of 05:00 GMT
Market Recap
It’s said in the market that USD/JPY “goes up by the stairs but down by the elevator shaft.” That’s because JPY is often used as a funding currency for carry trades – borrowing in a low-yielding currency and investing in a high-yielding currency. When these carry trades go wrong, as often happens (carry trades are sometimes referred to as “picking up nickels in front of a steam roller”), people rush to close them out by selling the currency they’ve invested in and repaying the currency they’ve borrowed.
The greatest example of this behavior was in 1998/99, when many hedge funds bought high-yielding Russian bonds and financed them by borrowing in yen. But on Aug. 17, 1998, the Russian government devalued the ruble , defaulted on its domestic debt, and declared a moratorium on payments to foreign creditors. Bam! The asset side of those trades collapsed. All the hedge funds then scrambled to unwind the liability side. They sold whatever they could to raise money – US stocks in many cases – and bought yen to repay their loans. As a result, USD/JPY collapsed (JPY soared). The selloff culminated in the week of Oct. 5-9, when USD/JPY fell by almost 19 yen in one week, from 135.50 to 116.65! It was the most brutal move I’ve ever seen short of an official devaluation.
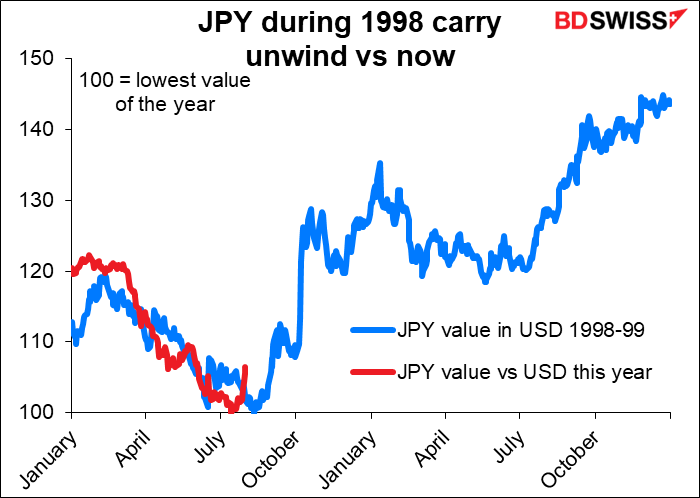
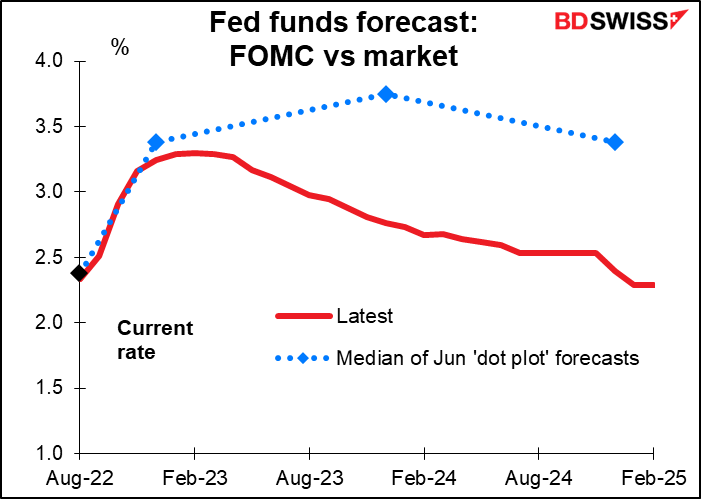
Are we likely to see the same thing again this time? I doubt it. That’s because, as I’ve said, I believe the market is overly optimistic about how high the Fed will hike and how soon it will cut. The market believes that the fed funds rate will peak around 3.3% next February and decline from there. The forecasts from last June’s Summary of Economic Projections however see the fed funds rate ending 2023 at 3.75%. Someone’s got to be wrong here. I think it’s the market. Given the strength in the US economy (see Is the US really in a recession?) I think it will take more than a 3.3% fed funds rate to defeat inflation.
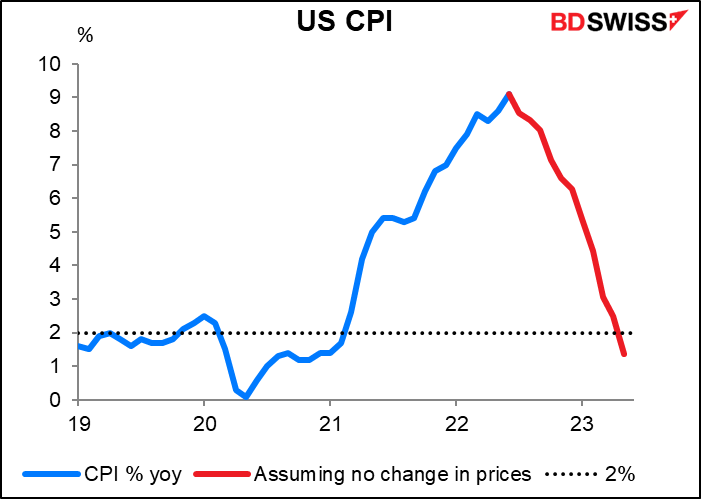
Even assuming no further change in prices, it would take until next May for the US consumer price index (CPI) to come back down to the Fed’s 2% year-on-year target. Next March, when the market is predicting that the Fed will start easing, the CPI would still be rising 3.1% yoy.
And how realistic is it to think that there will be no further increases in prices? Not very. Even the Federal Open Market Committee (FOMC)’s biggest dove, Minneapolis Fed President Kashkari (NV), Sunday admitted that “inflation continues to surprise us to the upside” and described the labor market as “very, very strong.” They’re not going to back off any time soon.
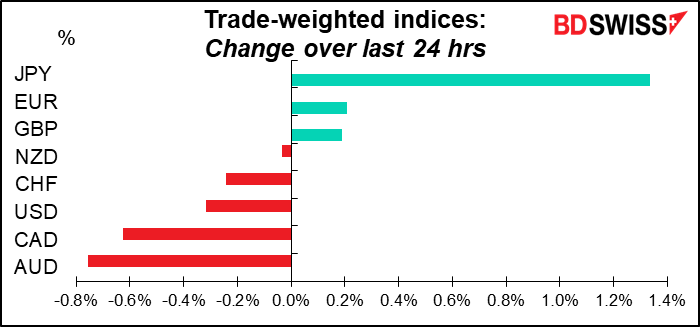
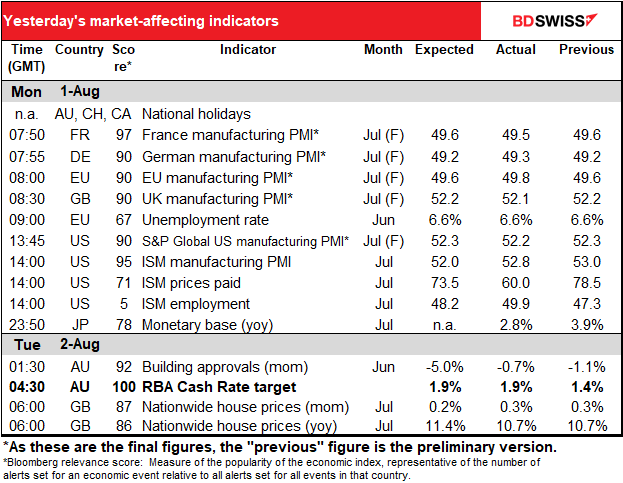
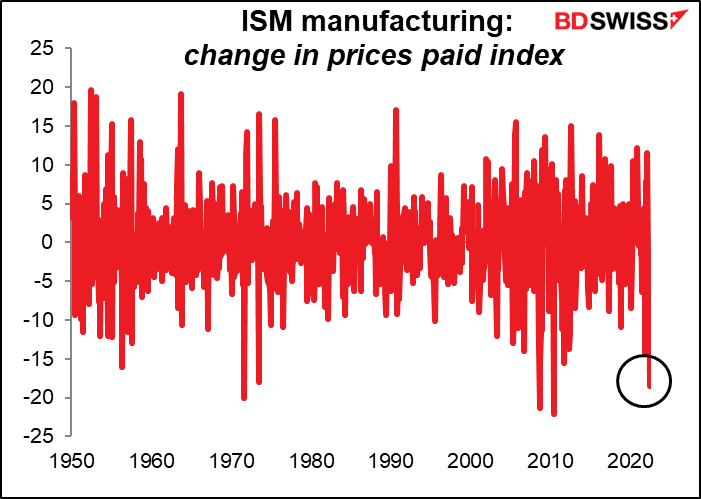
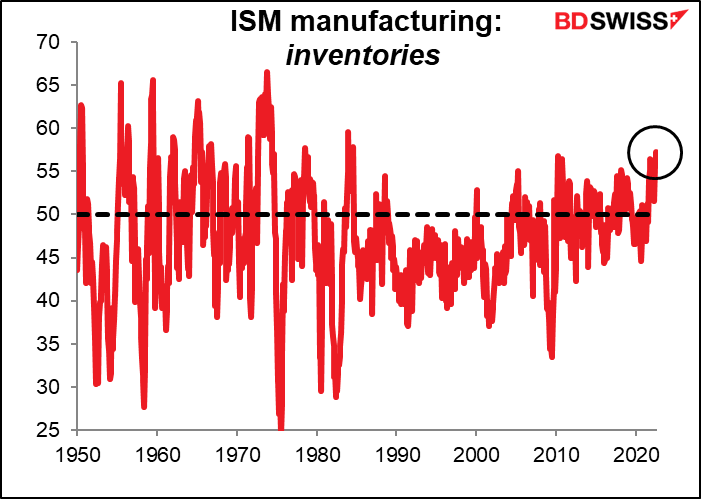
Having said that, the market thinks that they are. Yesterday’s US data fuelled those thoughts after Institute of Supply Management (ISM) manufacturing index fell to its lowest level since June 2020. The prices paid index fell much more than expected – the third largest drop in the last 50 years — (see table above), indicating that inflationary pressures are abating, while the inventory PMI is at the highest level in 38 years.
The economy is subject to change without notice. Things can change rapidly. I could be entirely wrong.
In Australia, the Reserve Bank of Australia hiked rates by 50 bps, as expected. This was their third consecutive 50 bps hike (their first hike, in May, was 25 bps). But they signaled that future hikes might not be as big. “The Board expects to take further steps in the process of normalising monetary conditions over the months ahead, but it is not on a pre-set path,” according to the statement following the meeting. Rate expectations are virtually unchanged after the decision, though.
Today’s market
Note: The table above is updated before publication with the latest consensus forecasts. However, the text & charts are prepared ahead of time. Therefore there can be discrepancies between the forecasts given in the table above and in the text & charts.
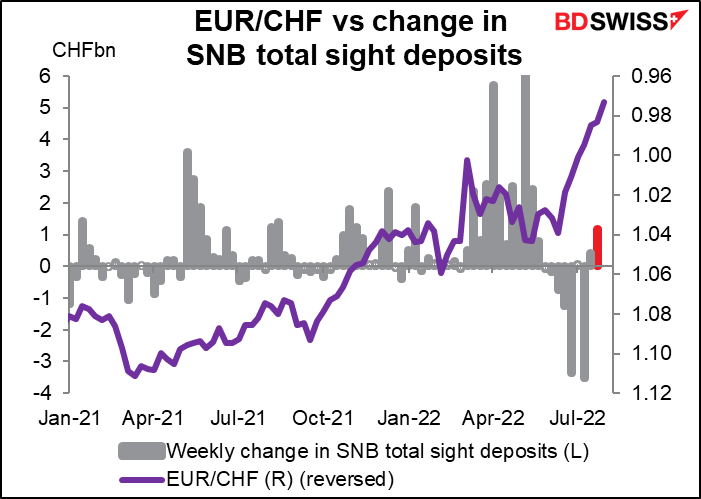
Since yesterday was a holiday in Switzerland, some Swiss indicators that should’ve come out yesterday came today, including the closely watched Swiss sight deposits. Last week they rose by the most since May. Perhaps the Swiss National Bank is trying to slow the descent of EUR/CHF now that it’s well-established under parity?
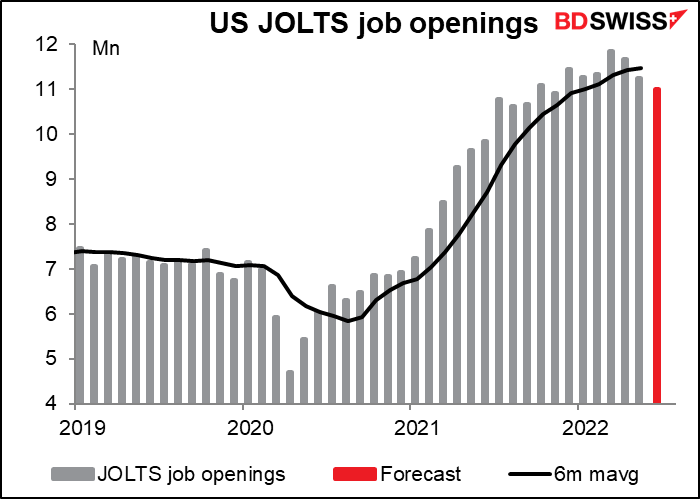
Then we wait for the US to open and the Job Offers and Labor Turnover Survey (JOLTS). This is sort of the converse of the unemployment figures: not people looking for jobs but rather jobs looking for people. It’s expected to show some 11.0mn vacancies down 254k from last month but still quite high.
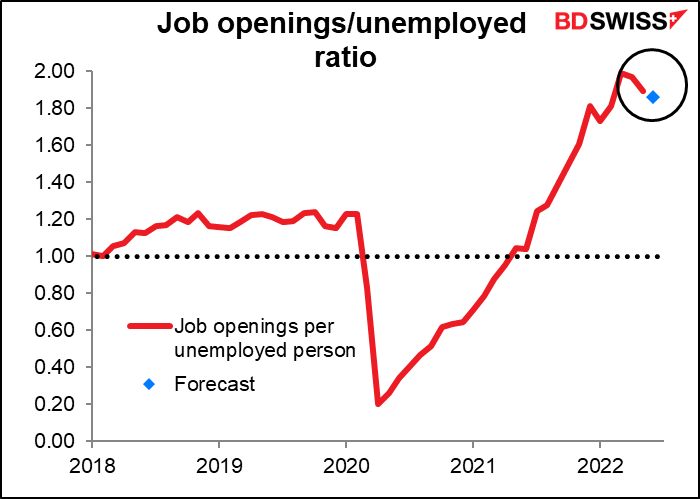
At that rate there would be 1.86 jobs for every unemployed person. This would confirm what Fed Chair Powell said at his press conference: that “the labor market has remained extremely tight” with “job vacancies near historical highs… Overall, the continued strength of the labor market suggests that underlying aggregate demand remains solid.” They can keep tightening without fear of throwing America out of work. USD
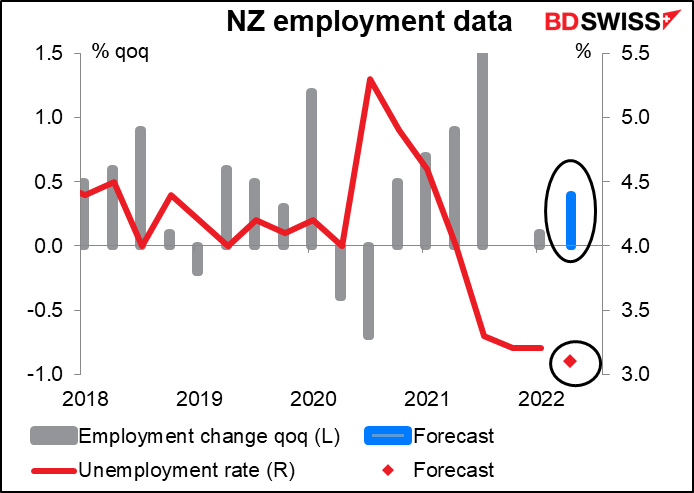
Then we wait until overnight to get the New Zealand employment data. The Reserve Bank of New Zealand (RBNZ) is one of those central banks that, like the Fed, has a “dual mandate” that requires it to strive for stable prices and “supporting maximum sustainable employment.” In NZ’s case though there’s no doubt that they’ve achieved that goal. Employment is already well above pre-pandemic levels and the unemployment rate is at a record-low 3.2 (data back to 1985). Unemployment is expected to fall further to a new record low and the number of employed persons to rise further. This will keep the RBNZ free to hike rates as fast as it cares to, which should be positive for NZD.
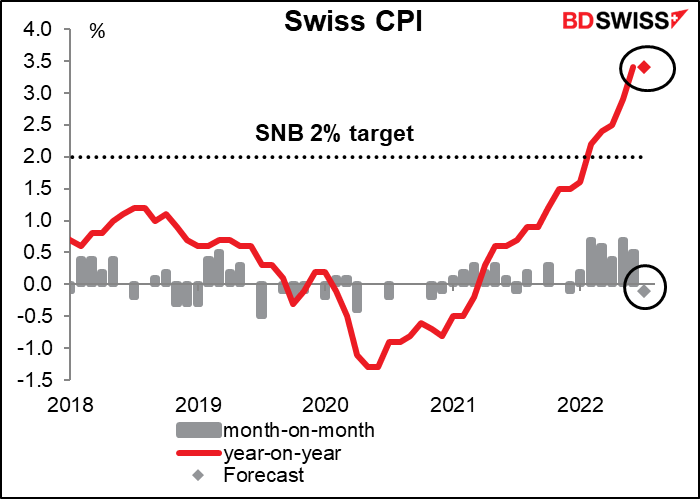
Then Wednesday morning at 6:30 GMT as the day begins, Switzerland releases its CPI. It’s expected to be down 0.1 percentage point month-on-month and unchanged on a year-on-year basis. Will that confirm to the SNB that its policy of letting the CHF appreciate has been a success and that they should continue it? Or will it tell them that with prices stabilizing they can let EUR/CHF stabilize too? Maybe it’s just wishful thinking but looking at the movement on Swiss sight deposits mentioned above, I think it’s likely to be the latter. The figure may be negative for CHF then.
Source: BDSwiss