Rates as of 05:00 GMT
It’s the first of July. This year I actually wrote down my New Year’s resolutions and taped them on the wall in front of me. With half the year gone, how am I doing? Alas, I abandoned three of the five completely, and probably won’t achieve the other two. Maybe at the start of the second half of the year I’ll take this opportunity to start working again toward my goals. On the other hand, I’ve still got some more episodes of Elementary to watch. Which will it be?…
Market Recap
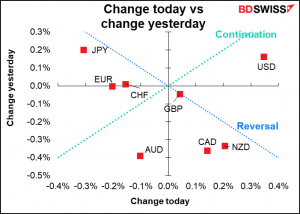
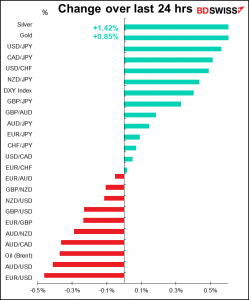
The “Change today vs change yesterday” graph highlights two notable discrepancies:
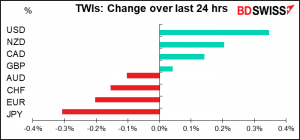
Generally speaking yesterday was a “reversal” day, with the commodity currencies gaining and JPY retreating. This is what I expected as the initial impact of the rising virus count subsided.
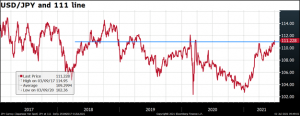
USD/JPY broke through the ¥111-line that I highlighted the other day. It will be interesting to see whether this brings in more USD/JPY selling from Japanese investors, in which case the pair is likely to go down further, or whether they throw in the towel and close out their positions, which could push USD/JPY much higher. I suspect the latter – I think they will join with the US speculators & hedge funds who are short JPY, which could weaken the currency further.
However within that move, USD, which had been rising along with JPY, didn’t go along – on the contrary, it continued to gain. This was probably due to end-month and end-quarter portfolio rebalancing, as I highlighted yesterday.
There may also be increasing acceptance of an early Fed taper. I thought it was significant yesterday that Fed Gov. Waller, who was appointed specifically because of his dovish views, yesterday said the better-than-expected performance of the US economy warrants scaling back asset purchases sooner than expected. “This year has been a surprise. None of us back in December would have thought the economy would be where it is right now,” Waller said. “Given the way the economy has progressed, I think everybody anticipates tapering could move up earlier than when they originally thought. Whether that’s this year, we’ll see, but it certainly could.”
Secondly, AUD was an outlier among the commodity currencies, falling while NZD and CAD rose. CAD was bolstered by higher-than-expected April GDP (-0.3% mom vs -0.8% expected), which shows the resilience of the Canadian economy in the face of the third wave of the virus. NZD may have been boosted by a report from ANZ Bank saying that the country is rapidly approaching full employment and the Reserve Bank of New Zealand may need to raise rates sooner than February 2022. I’m afraid I can’t find any reason for the underperformance of AUD, however.
SNB intervention
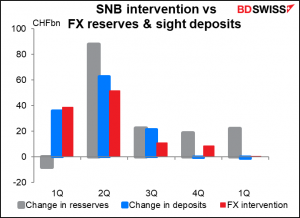
The Swiss National Bank (SNB) yesterday released its quarterly intervention data. It drove home a point that I’ve made before: the weekly sight deposit data is usually a better measure of SNB intervention than the monthly foreign exchange reserve data. That’s because the FX reserves are in various currencies and so subject to currency translation issues, whereas the sight deposits are all in CHF.
Today’s market
Note: The table above is updated before publication with the latest consensus forecasts. However, the text & charts are prepared ahead of time. Therefore there can be discrepancies between the forecasts given in the table above and in the text & charts.
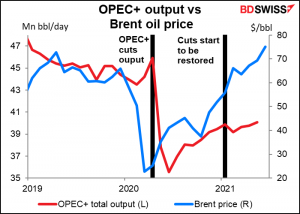
There’s an OPEC meeting today. As I’m sure you know, the group agreed to cut their overall output by 9.7mn barrels a day (b/d) to match supply with demand during the pandemic. Now that the pandemic is easing and demand is reviving, they’re debating how quickly they should lift their output restrictions. From May to July they increased production by some 2mn b/d. At this meeting they’ll decide whether to hike output in August or September or to wait even longer. The disagreement seems to be between Russia and Saudi Arabia, the two biggest producers, who often disagree on tactics. Russia apparently would like to increase output faster than the Saudis would. The market expects that they’ll agree to lift production by about 550k b/d, which is roughly 10% of their spare production capacity.
As for the data, the focus today will be the manufacturing purchasing managers indices (PMIs), including the revised final versions for those countries that issued preliminary versions. Sometimes the revisions move the market if they’re big enough.
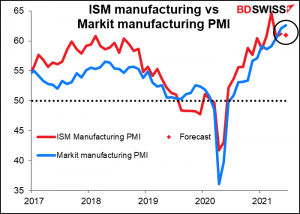
Along with the manufacturing PMIs comes the Institute of Supply Management (ISM) version of the same thing. This is a less accurate gauge of the conditions of the US manufacturing base but perhaps a better gauge of the US manufacturing industry, in that the Markit version only asks about their US operations whereas the ISM version asks about the company as a whole. So the Market version may better represent the conditions in the US, which makes it the appropriate index for FX investors to watch, while the ISM version may better represent the conditions of the company as a whole and is therefore a better indicator for equity investors.
The ISM version didn’t fall as far as the Markit version did during the pandemic, perhaps because companies’ global operations cushioned the blow. Then again, the ISM index has been higher than the Markit version for some time, so perhaps it’s not surprising.
In any event, the two were about equal in April and the ISM was below the Markit version in May. This month it’s expected to fall a little further. But given the relatively high level, it corroborates the Markit manufacturing PMI evaluation of a continued strong expansion.
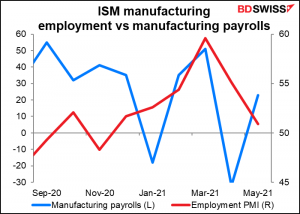
Within the ISM, analysts will be watching the prices-paid PMI, as usual, and especially the employment PMI. Its sharp fall last month was puzzling.
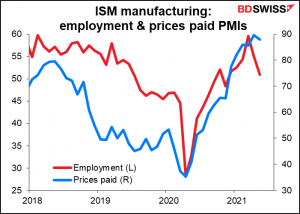
The point is that manufacturing payrolls tend to follow the ISM manufacturing PMI.
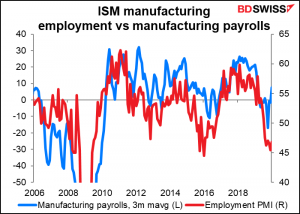
That makes the recent decline in the PMI worrisome.
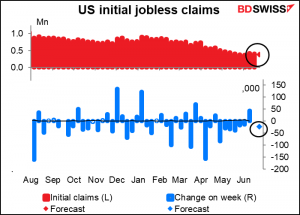
Finally, the weekly US jobless claims will attract their usual attention.
After last week’s surprising 44k rise, initial jobless claims are expected to fall by 25k. That should restore some faith in the employment situation. Another rise and people might start to think that the improvement is stalling, which would be deadly for the dollar.
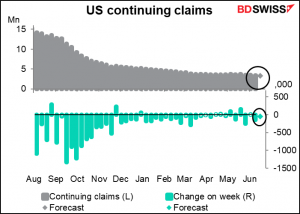
People are once again focusing on the continuing claims as 26 sadistic and cruel state governments, controlled by you-know-who, have decided to terminate the $300/week federal unemployment benefits early in order to starve people back into jobs that don’t pay enough for them to live on. This move can be summed up as “cutting off your constituents’ noses to spite their faces.” The funds come from the federal government and therefore don’t cost the state governments anything, yet they’re turning down the money because they think it’s the reason why some companies are finding it hard to hire people. So far the indications are that that’s wrong. According to the NYT, in Missouri, which ended the benefits early, “work-force development officials said they had seen virtually no uptick in applicants since the governor’s announcement…And the online job site Indeed found that in states that have abandoned the federal benefits, clicks on job postings were below the national average.”
Source: BDSwiss