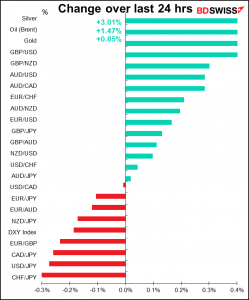
Rates as of 05:00 GMT
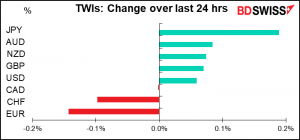
Having failed to find suitable trade-weighted indices, I’m experimenting with making my own, using the weights supplied by Citibank. Please bear with me for a few days while I work out the bugs.
Market Recap
With Japan, China and the UK out for a holiday yesterday, trading was relatively quiet. Stock markets generally had a “risk-on” mood, but the FX market wasn’t 100% convinced, if my new TWIs are to be believed.
With the Tokyo market closed, USD/JPY had some wild trading – it ranged between a high of 109.70 during the Asian day to a low of 108.90 in the European afternoon/New York morning. It’s now back in the middle of that range. I don’t think there was any news out to justify such a wide range, just technical trading.
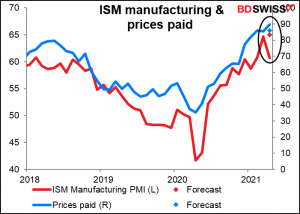
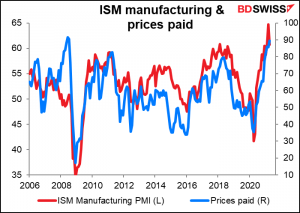
Global rates began drifting lower as the US day began. The decline accelerating after a surprising miss in the US Institute of Supply Management (ISM) manufacturing PMI, which fell to 60.7 from the previous month’s 37-year high of 64.7 instead of rising to 65.0 as expected.
Yields continued to decline despite a much higher-than-expected prices-paid index, which rose to 89.6 from 85.6 (vs 86.0 expected). This is the highest level in nearly 13 years. The press release also hinted at inflationary pressures to come. It said, “The current electronics/semiconductor shortage is having tremendous impacts on lead times and pricing. Additionally, there appears to be a general inflation of prices across most, if not all, supply lines.” This is similar to what many companies have reported in their earnings results recently, causing several to lower their forecasts for production despite rising consumer demand. Also, the ISM hinted at wage pressures to come when it said, “the Employment Index expanded for the fifth straight month, but panellists continue to note significant difficulties in attracting and retaining labor at their companies’ and suppliers’ facilities.”
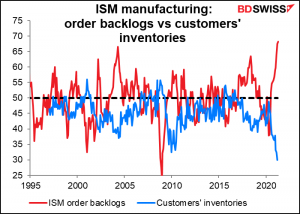
Order backlogs hit a record high while customer’ inventories hit a record low. This is an invitation for manufacturers to grasp pricing power.
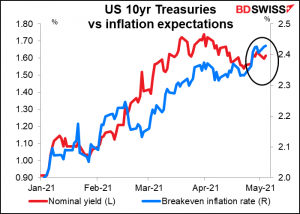
Yields remained lower even after the Treasury more than quadrupled its borrowing estimate for Q2 and said it expects to need some $1.3tn over the second half of the FY as a result of President Biden’s $1.9tn pandemic relief bill. Ten-year yields fell 3 bps (but rose 1 bp this morning) even though the break-even inflation rate rose 2 bps.
Lower nominal yields higher inflation expectations = lower real yields, of course. That’s a negative for USD.
What explains the Treasury market’s insouciance in the face of higher inflation fears? Probably growing confidence that the Fed won’t raise rates any time soon. Fed Chair Powell spoke yesterday, the first time since Dallas Fed President Kaplan (non-voter) Friday said that “at the earliest opportunity” the Fed should start talking about tapering its bond purchases. Powell on the other hand said that the economic outlook in the US “has clearly brightened,” but “it has been slower for those in lower-paid jobs.” He noted that “almost 20% of workers who were in the lowest earnings quartile in February of 2020 were not employed a year later, compared to 6% for workers in the highest quartile.” What this suggests is that the Fed is likely to ignore inflationary pressures (unless they get too, too strong) in favor of allowing employment and wages to rise.
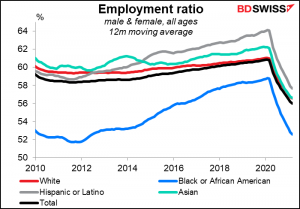
Meanwhile, Richmond Fed President Barkin (voter) and NY Fed President Williams (voter) both indicated that an employment-to-population ratio near the pre-pandemic level of 61%, would qualify as good progress on the labor market. This corresponds to what I said in my Weekly Outlook, that the participation rate is likely to become a more important indicator for divining Fed policy.
Note though the much lower employment ratio for Blacks. It made tremendous strides, rising from 51.7% in December 2011 to 58.8% in February 2020, just before the pandemic hit. However, it’s collapsed back to 52.6%, a fall of 6.2 percentage points. By comparison, the overall index has only fallen 4.8 ppt and that for Whites is down 4.5 ppt. (Calculations done using 12m moving averages.) Powell et. al. will be sensitive to this difference as well as to the overall level of unemployment.
As Chair Powell said in yesterday’s speech:
The pain is all the greater in light of the gains we had seen in the years prior to the pandemic. COVID swept in as the United States was experiencing the longest expansion on record. Unemployment was at 50-year lows, and inflation remained under control. Wages were moving up, particularly for the lowest-paid workers. Long-standing racial disparities in unemployment were narrowing, and many who had struggled for years were finding jobs. It was not until the later years of that expansion that its benefits had started to reach those on the margins. During our Fed Listens events, we met with people around the country and heard repeatedly about the life-changing gains of the strong labor market, particularly at the lower end of the income spectrum. Just a few months later, those stories changed to ones of job losses, overextended support services, and businesses built over generations closing their doors for good.
I think this new focus on monetary policy as a tool of social policy is likely to keep interest rates lower for longer than they would otherwise be, which is likely to be detrimental to the dollar.
As for the Reserve Bank of Australia (RBA), they kept policy on hold as expected and said that they would review their yield curve control program at the July 6th meeting. They subtly changed their view on how long rates would be at current levels; saying it was “unlikely to be until 2024 at the earliest” before conditions were ripe for increasing the cash rate. Last month they said, “The Board does not expect these conditions to be met until 2024 at the earliest.” This sounds a little bit less certain to me, but I may be reading something into it.
At the same time, they revised up their forecasts for GDP growth and revised down their forecast for unemployment, but they still don’t expect inflation to rise into their 2%-3% target range on a sustainable basis.
Attention now shifts to Friday’s release of the quarterly Statement on Monetary Policy (SMP), which will contain the new forecasts, and next week’s Budget. Those will set the stage for July’s rethink of the yield curve control program. Ending yield curve control would be a positive move for AUD. Given the way the Australian economy is going, I think that’s likely to happen.
Today’s market
Note: The table above is updated before publication with the latest consensus forecasts. However, the text & charts are prepared ahead of time. Therefore there can be discrepancies between the forecasts given in the table above and in the text & charts.
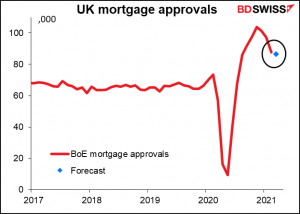
UK mortgage approvals are expected to drop somewhat, but remain unusually high. They’ve been at these exceptionally high levels thanks to last summer’s reduction in stamp duty, which was scheduled to expire at the end of March. It’s been extended to the end of June, so the housing boom is likely to last for a few more months. Fuelled by the tax cut plus changes in work habits, the average price of a house in Britain rose to a record high in April.
Then a number of second-tier indicators when North America opens for business.
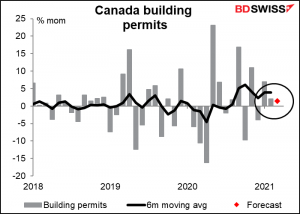
The housing market in Canada has been quite hot recently, but building permits didn’t rise much in February and aren’t expected to rise much in March either, indicating that perhaps the boom is subsiding.
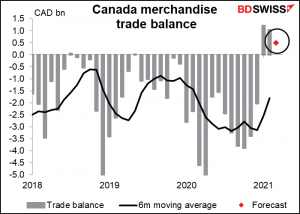
Canada’s merchandise trade has been registering an unusual surplus recently as exports rise yoy but imports struggle. With commodity prices continuing to rise, the value of exports probably rose further. Still, with the economy recovering, imports of consumer goods probably increased too, shrinking the trade surplus. CAD-
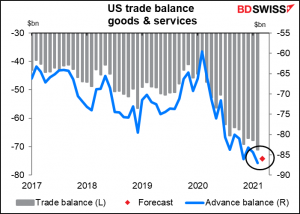
The US trade balance on the other hand is expected to fall further into record deficit. No surprise there as the merchandise trade balance (blue line) continues to deteriorate. In the US, when the going gets tough, the tough go shopping! Especially when the government is handing out $1,400 checks to everyone (except me). US retail sales in March lept 9.7% mom to a record $614.4bn. It’s no surprise if a good portion of that is imported. And as the US recovers earlier than most other major economies (I’m looking at you, EU – you’re the biggest trading partner of the US) it’s no surprise if US imports rise faster than those of many other countries.
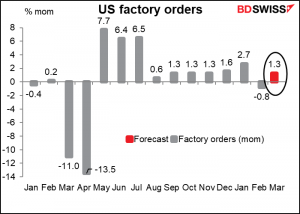
US factory orders are expected to be up, but since these are basically a function of durable goods orders (which were up 0.5% mom), I find them boring.
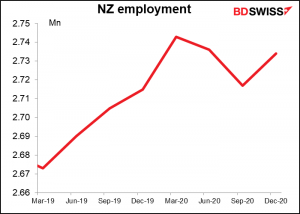
Then we just wait until Lo! in the orient when the gracious light/Lifts up his burning head and New Zealand releases its employment data. The number of jobs is expected to increase by 0.3% qoq, with the unemployment nonetheless remaining unchanged at 4.9% as the participation rate – currently 70.2 vs the pre-pandemic Q1 2020 level of 70.7 – recovers somewhat.
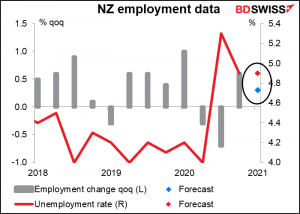
A 0.3% rise in jobs could put the country back to where it was before the pandemic. In December the country was 9,000 jobs or 0.33% within recovering its pre-pandemic level of jobs.
Then the Reserve Bank of New Zealand (RBNZ) publishes its twice-a-year Financial Stability Report (FSR). The key thing people are interested in is the RBNZ’s assessment of housing market conditions. Following the reinstatement of macroprudential measures to control housing in March, the RBNZ may take a more sanguine view of the issue, which would eliminate one possible impediment to further easing. The change in stance vis-à-vis housing could be negative for NZD.
RBNZ Gov. Orr will hold a pres conference on the FSR and then testify on the report at the Finance & Expenditure Select Committee of Parliament.
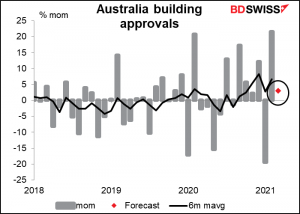
Australian building approvals have been soaring under the Government’s wildly popular HomeBuilder program to subsidize housing purchases or renovations, which closed April 14th. They’re expected to have risen further in March as the last few people rushed to get in before the deadline.
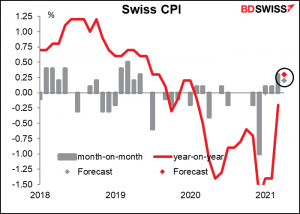
Then it’s off to Europe to await the Swiss consumer price index (CPI). This should be exciting as the yoy rate of change is forecast to be positive for the first time since Sep. 2019. Inflation, finally! Does this mean the Swiss National Bank (SNB) will declare victory, fold up its tent and fade away? No way! Inflation of 0.2% yoy is still far away from what they want. Furthermore, they’re still worried about the currency, which recently has been going the wrong way. While good news for the SNB, this is not likely to make much of a difference to the SNB and therefore not much of an impression on CHF.
Source: BDSwiss