Rates as of 06:00 GMT
Market Recap
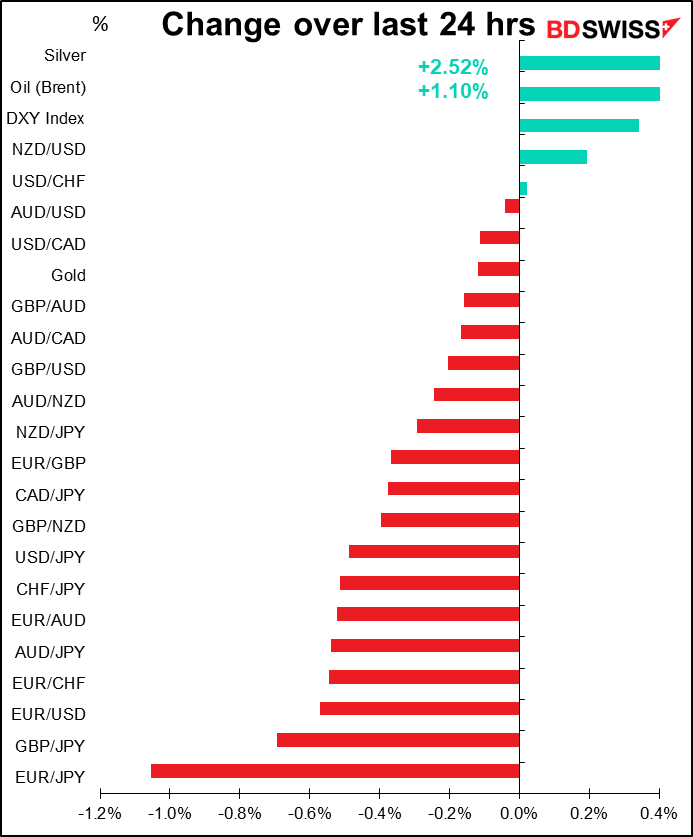
It was almost a “sea of red” today except for Brazil’s IBOVESPA index, which was up 0.3%. Otherwise…
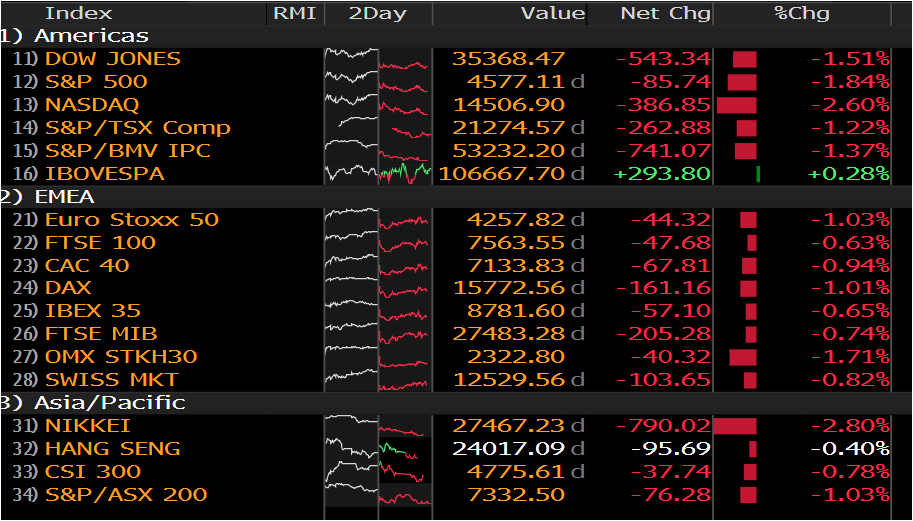
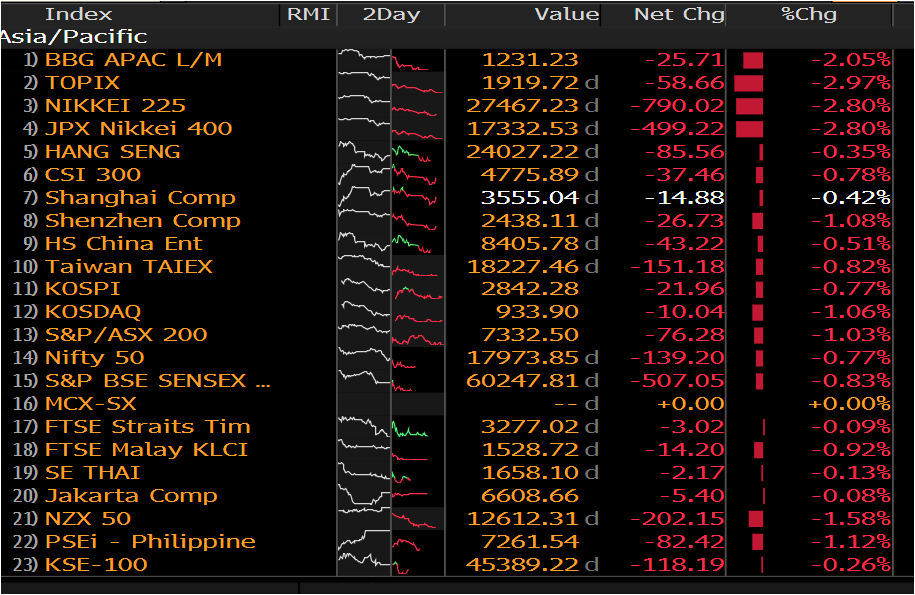
Asian markets this morning are:
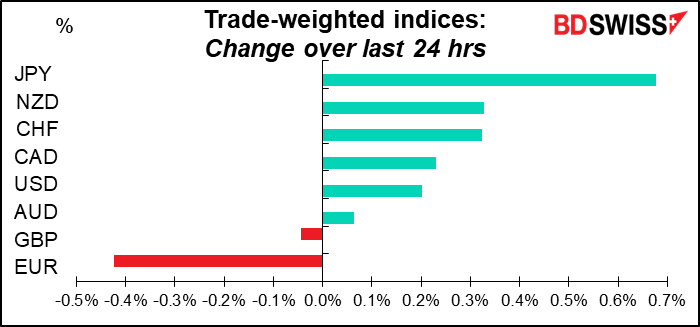
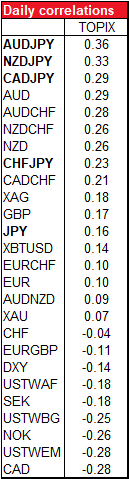
So with that in mind, perhaps it’s no surprise that JPY is the strongest currency. The three currency pairs with the highest positive correlation with the S&P 500 are all JPY crossrates (although note that USD/JPY, at 0.34, doesn’t have a particularly high correlation).
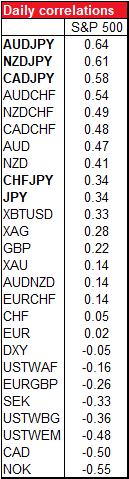
Interestingly (at least interesting to me), USD/JPY’s correlation with the TOPIX index of Japanese stocks is lower than its correlation with the S&P 500 (0.16 vs 0.34). So are most of the other JPY cross-correlations. This would correspond with Japanese investors hedging the currency against their profits & losses in overseas markets, or the global risk sentiment, rather than domestic.
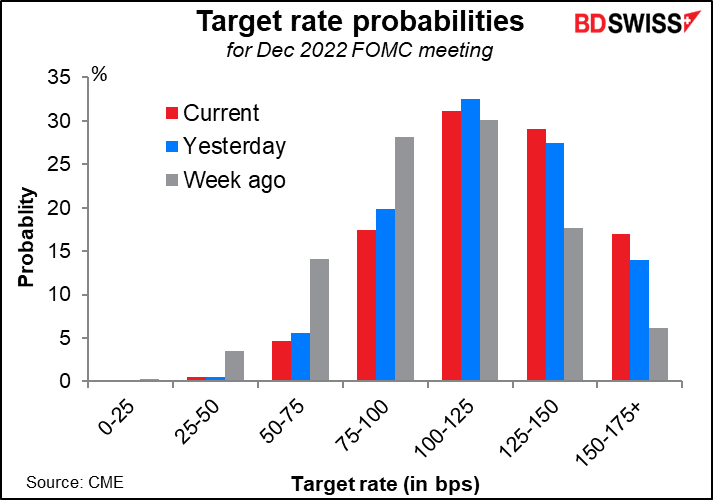
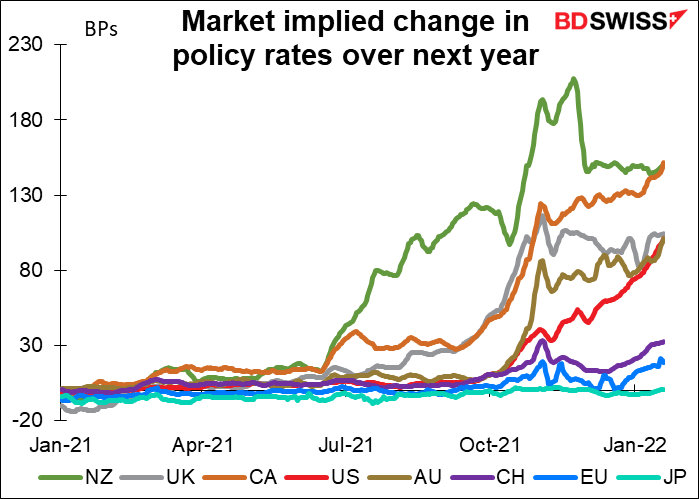
The story behind the move was a further rise in bond yields as investors discount greater Fed tightening. The market still sees four rate hikes this year, but the odds of that are falling while the odds of five, six, or even more are rising. Meanwhile, the odds of only three hikes – what all but two members of the rate-setting Federal Open Market Committee themselves forecast only a little more than a month ago – has fallen to just 17%.
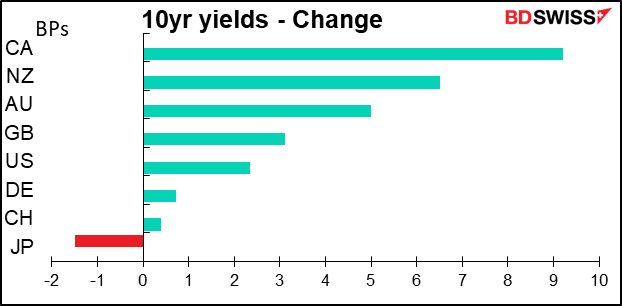
Nor is it just the Fed – the market also assumes a rate hike at the Bank of Canada and Reserve Bank of New Zealand meetings next week and the Bank of England meeting in early February.
As a result, bond yields rose around the world (except for Japan), although there was no correlation between the change in yields and the change in currencies.
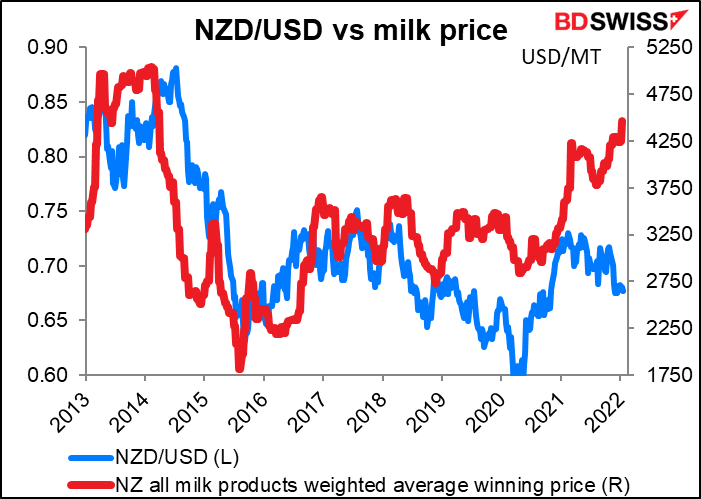
NZD was the second-best performing currency, perhaps on the back of a good milk auction Tuesday. The weighted average winning price rose 5% from the previous auction. Admittedly the correlation between NZD/USD and milk prices hasn’t been very good for the last several years, but it may explain today’s move. Milk products are the country’s largest export, accounting for 27% of total exports.
The remaining question then is, why is EUR down? I think it comes down to European Central Bank (ECB) policy. When the market is focused on expected rate hikes, the fact that the ECB is expected to be the second-slowest of the major central banks in raising its rates – even behind the Swiss National Bank, which hasn’t changed policy since 2015 – is probably a killer.
Today’s market
Note: The table above is updated before publication with the latest consensus forecasts. However, the text & charts are prepared ahead of time. Therefore there can be discrepancies between the forecasts given in the table above and in the text & charts.
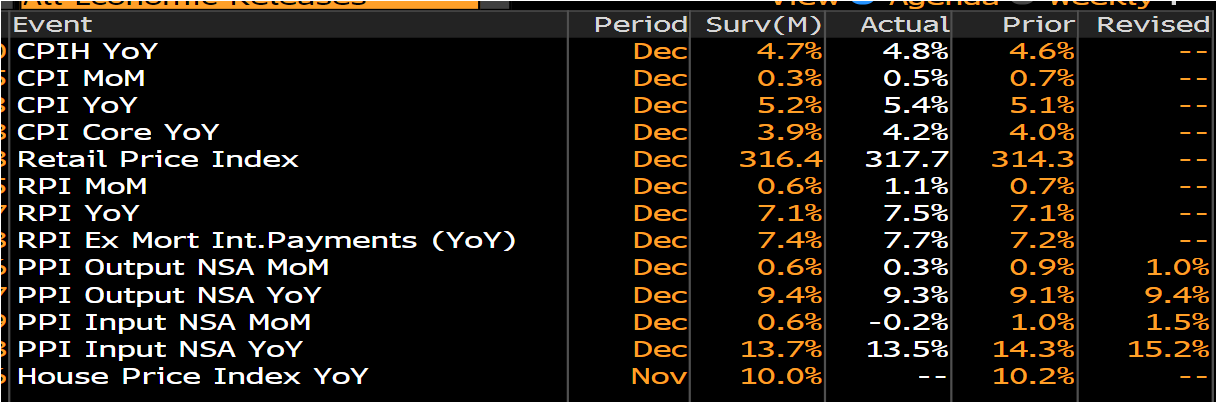
We already discussed today’s UK consumer price index (CPI) yesterday. The data came in higher than expected on the retail side, although producer prices missed estimates. GBP/USD got only a temporary pop however. The market is already assuming a rate hike at the Bank of England meeting on Feb. 3rd so perhaps it’s hard for inflation to move the dial further.
It may be that politics are starting to catch up with GBP. The news was filled with talk that PM Boorish Johnson is facing a threat from Members of Parliament (MPs) from his own Conservative party who were elected in 2019. They met yesterday to discuss Johnson’s future and some claimed they will soon have the necessary support to trigger a confidence vote in Johnson. It’s not certain that he would lose the vote even if they held it, but uncertainty is never good for a currency – except of course when the status quo is so bad that people think any change is likely to be for the better.
Canada’s CPI is expected to be down one tick on a mom basis but up one tick on a yoy basis. The core CPIs are also forecast to rise.
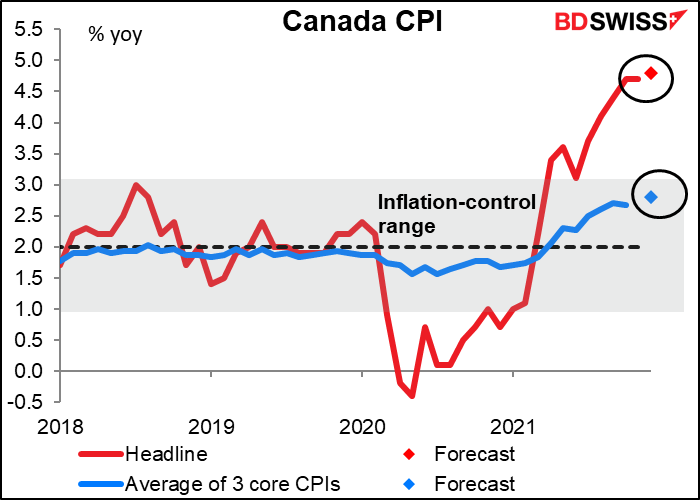
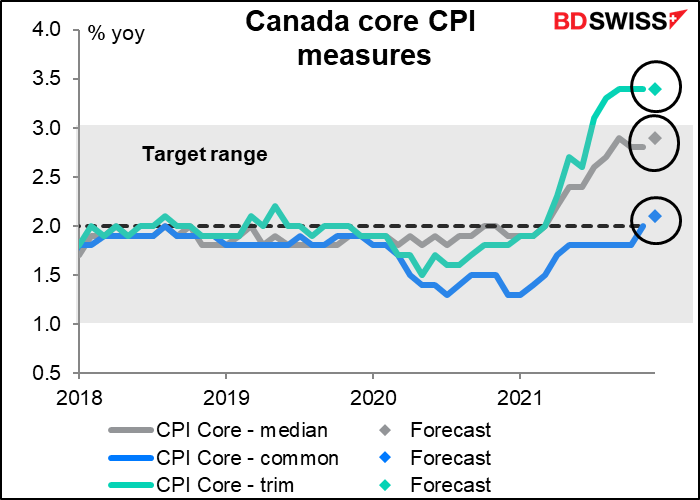
Two of the three core measures are expected to be up 10 bps. One is already above the Bank of Canada’s target range, while another is getting there slowly but surely.
The Bank of Canada said it’s committed to holding its policy rate at the zero bound “until economic slack is absorbed so that the 2 percent inflation target is sustainably achieved.” It estimated that that would happen “sometime in the middle quarters of 2022.” At the moment the market is assuming a rate hike at the March 2nd Bank of Canada meeting, but a higher CPI in December could encourage some speculation about a change in policy at their Jan. 26th meeting. That could be positive for CAD.
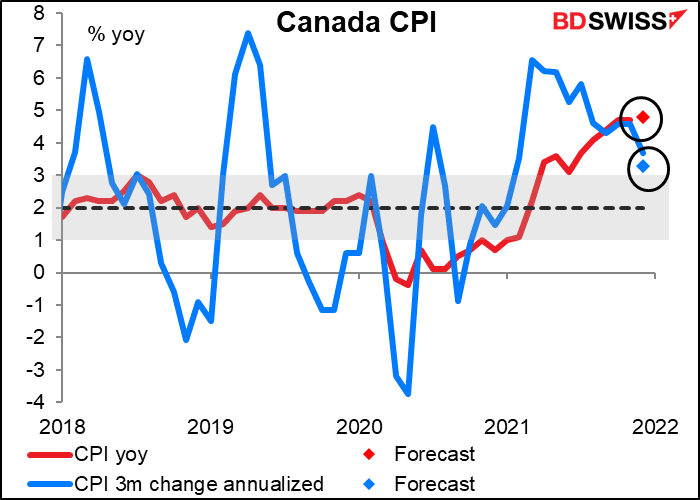
On the other hand, there are indications that inflation in Canada is slowing. The three-month change in inflation, annualized, has been dropping for some time now and is expected to fall further. It’s well below the yoy rate (3.3% vs 4.8%, based on the forecasts for today’s numbers).
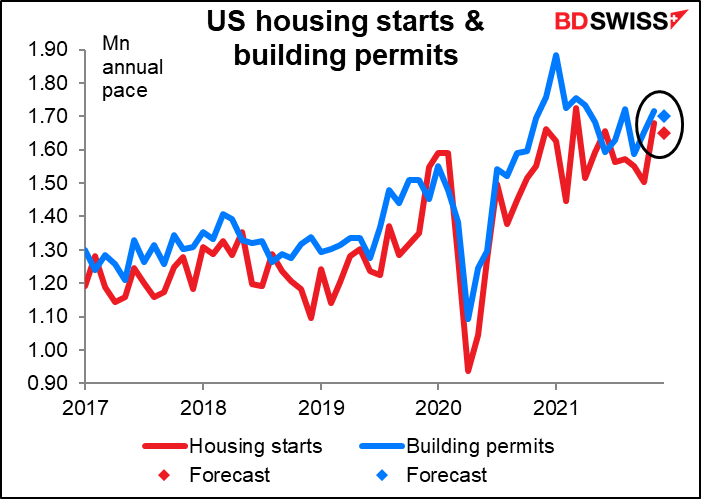
US housing starts and building permits are both expected to be slightly lower but within the recent range. It looks as if housing has stabilized somewhat. In that case, these figures shouldn’t have much impact on the market.
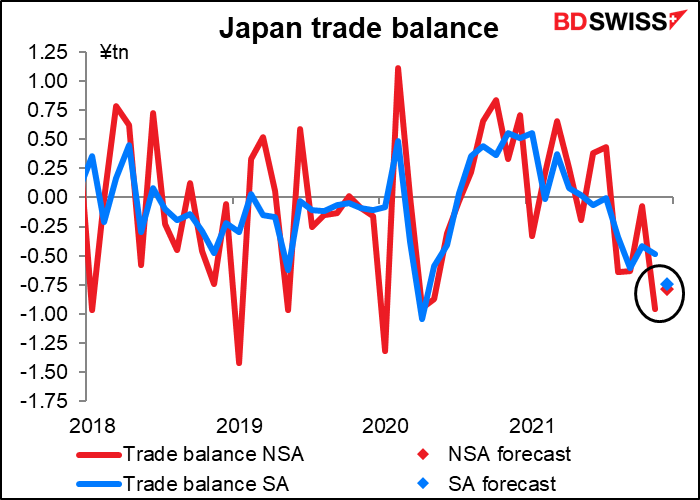
Overnight, Japan announces its trade balance. It’s expected to be a bit higher on a seasonally unadjusted basis but lower on a seasonally adjusted basis (which I consider to be the more important, but for some reason the domestic market follows the NSA figure.)
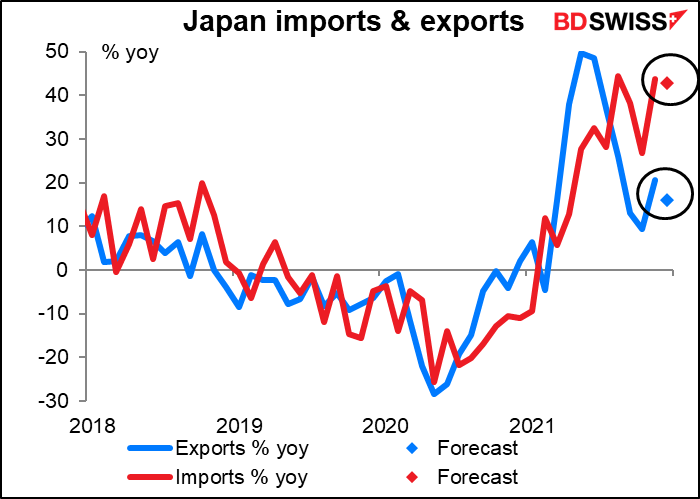
Growth in both imports and exports is expected to slow, but growth in exports is expected to slow more — worrisome for the country since they’re growing by less to begin with.
The country’s trade balance has been plunging deeper and deeper into deficit as imports grow much faster than exports. (Note: the latest month for this graph is based on the consensus forecasts.)
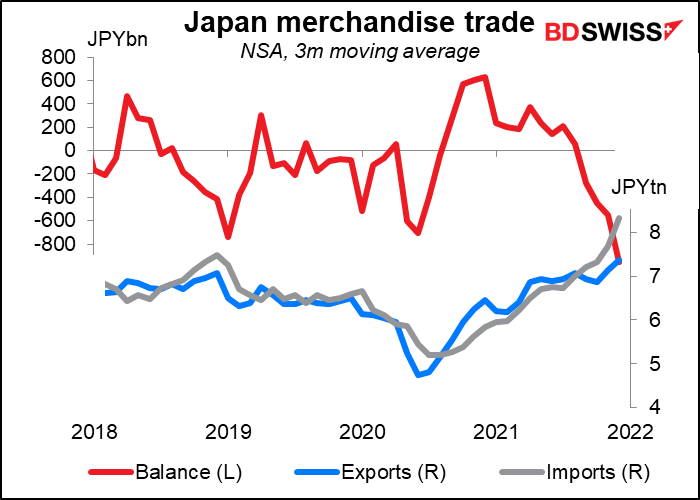
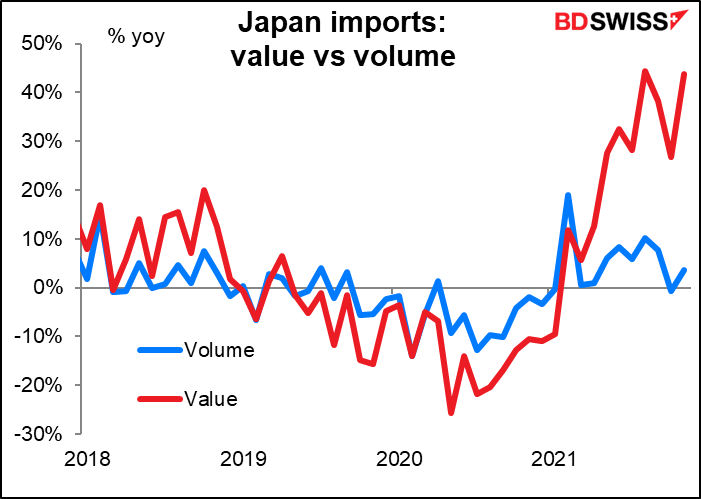
The problem is imported inflation. The value of Japan’s imports is rising rapidly even though the volume isn’t. In November the value of imports was up 44% yoy while the volume was up only 3.6%. A lot of that is raw materials, which are up 50% in value over the last year (lumber 136%, iron ore 111%, etc.) Minerals & fuels are up 144% in value and semiconductors 61%.
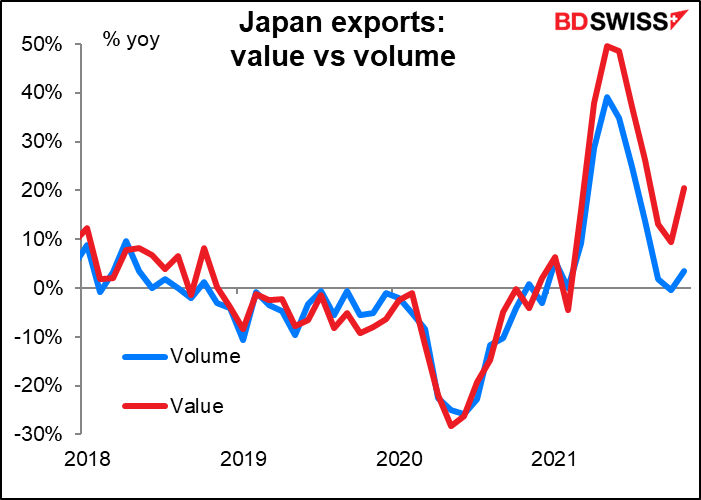
Meanwhile, the value of Japan’s exports is growing largely in line with the volume of exports, as befits a country where prices are barely rising at all. The question is, how long can companies keep their prices stable while the price of imported inputs rises?
This is why the Japanese government is slowly coming around to the idea that a weak yen is maybe not a good idea, that on the contrary they should try to have a stronger yen. FX market participants should watch this trend closely and watch for signs of a change in sentiment among officialdom!
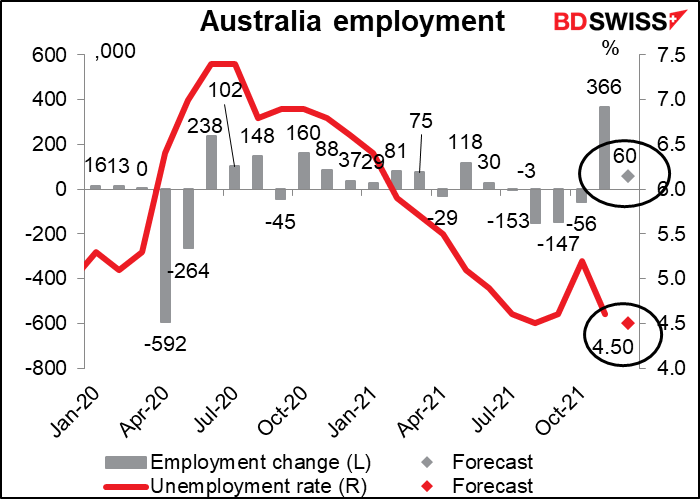
Finally, Australia announces its employment data. This is important since the Reserve Bank of Australia is one of those central banks that has a “dual mandate” requiring it to take employment into account as well as inflation.
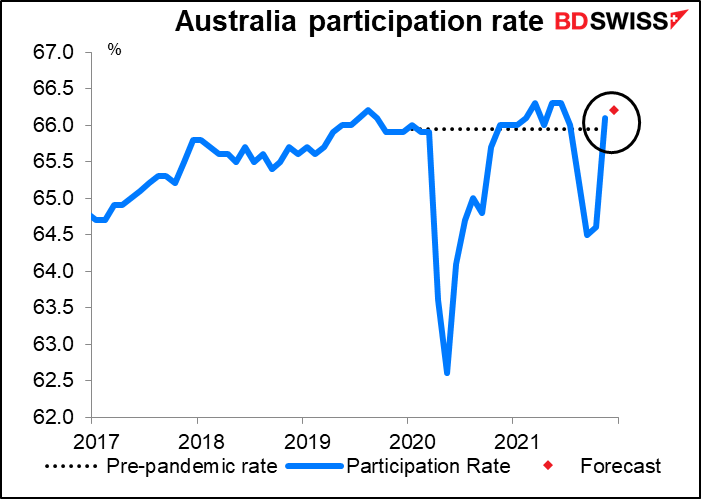
With employment expected to rise slightly and the unemployment rate forecast to fall further below the pre-pandemic level of 5.1%, the labor market looks supportive of AUD.
The number of people working has already surpassed the number working before the pandemic hit, although it’s not yet back up to where it would be if employment had continued to grow at trend.
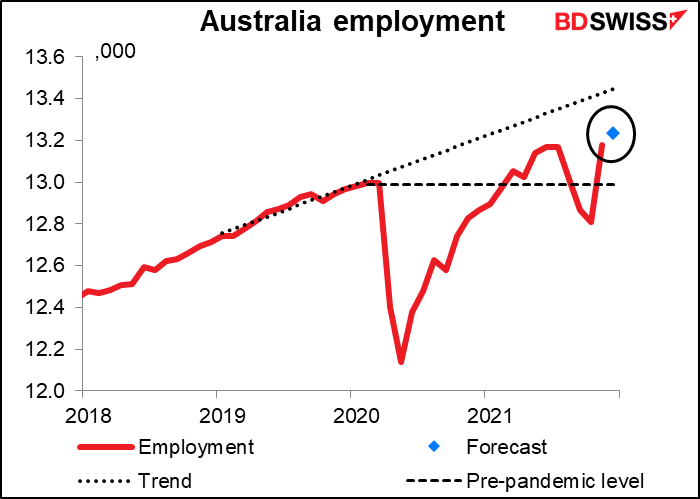
While the participation rate is also above the level immediately prevailing before the pandemic hit.
The RBA though is focusing on growth in wages, Its forward guidance reads, “The Board will not increase the cash rate until actual inflation is sustainably within the 2 to 3 per cent target range. This will require the labour market to be tight enough to generate wages growth that is materially higher than it is currently.” (emphasis added) The wage data is only released quarterly; the next release is on Feb. 23rd.
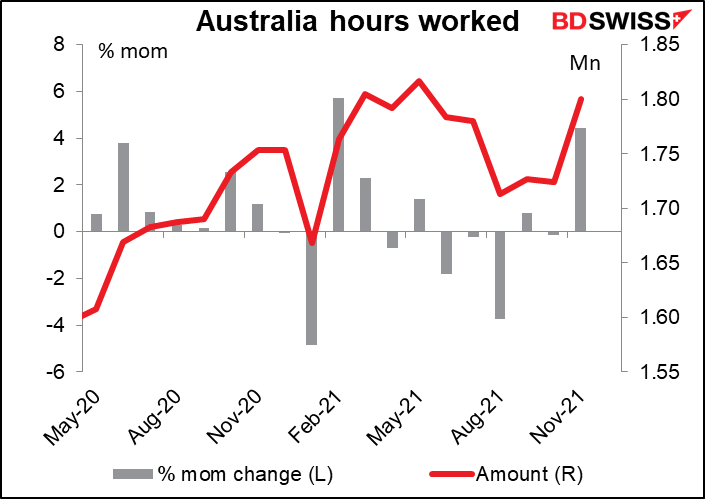
Until then, the market is also paying attention to hours worked, which also comes out with the employment data (no forecast available).
Source: BDSwiss