Rates as of 05:00 GMT
Market Recap
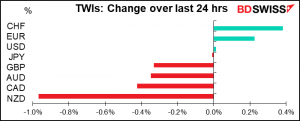
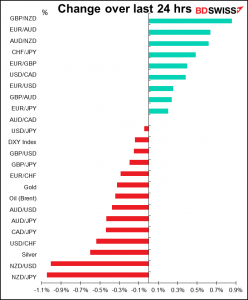
The focus this morning is on, which plunged after the NZ government introduced a raft of new measures aimed at holding down house prices. (I’m not going to bore you with the details, if you’re interested you can read about it on Bloomberg or The Guardian, which doesn’t have a paywall.) The key point is that there are two ways to rein in house prices: through legal and financial measures like what they did, or by raising interest rates. Since they took the first route there’s not going to be any need for them to take the second route.
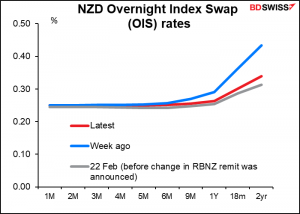
You may remember back on Feb. 24, when Finance Minister Grant Robertson announced that the Reserve Bank of New Zealand (RBNZ)’s remit would be amended so that the bank considers “the impact on housing when making monetary and financial policy decisions.” The kiwi jumped when that announcement was made as investors assumed it would mean higher interest rates – that the RBNZ would have to raise rates, in order to hold down house prices. Well, the government found another, more focused way to accomplish that goal without using the blunt tool of higher interest rates and so the market is no longer pricing in a rate hike this year. Rate expectations have fallen back to where they were before the change to the remit was announced.
Moves like this often continue for some time so I’d expect NZD and AUD to remain weak today.
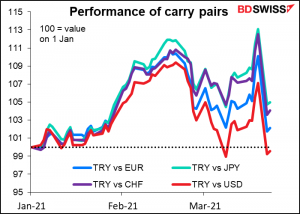
The big move in NZD only masks other significant moves in the market today too. CHF was the best-performing currency; my guess is that there must have been significant CHF-funded carry trades in TRY that suddenly unwound. I’d expect this to be only a temporary move for CHF though as I still think that with “monetary policy divergence” coming along, CHF will be an attractive funding currency for carry trades — the Swiss National Bank is likely to be on hold indefinitely.
The lack of overall movement in USD – net unchanged on a trade-weighted basis – was significant as the Treasury market largely unwound last week’s moves around the Fed meeting. Ten-year yields declined 2.6 bps yesterday and have continued to decline this morning – they’re now down to 1.66%, nearly back to the 1.62% close last Tuesday, before the FOMC meeting (the intraday high was Thursday @ 1.75%). Even more so with the 30-year, which is trading this morning at 2.36%, below last Tuesday’s 2.38%.
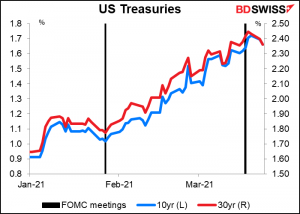
Furthermore, the decline was due to a fall in real yields rather than a drop in inflation expectations. On the contrary, long-term inflation expectations (as measured by breakeven inflation rates) generally rose.
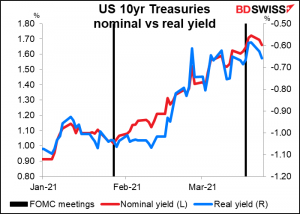
The fall in yields – both nominal and real – may set the dollar up for further declines, in my view.
Today’s market
Note: The table above is updated before publication with the latest consensus forecasts. However, the text & charts are prepared ahead of time. Therefore, there can be discrepancies between the forecasts given in the table above and in the text & charts.
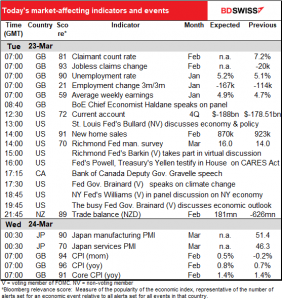
The highlight of the day will not be any of the data but rather Fed Chair Powell and his predecessor and now Treasury Secretary, Janet Yellen, appearing before the House Financial Services Committee to testify about the Coronavirus Aid, Relief, and Economic Security (CARES) act. No surprise that they said, “the fiscal support is great, we need to keep it coming.” What we’re really waiting for is the Q&A, during which time I’d expect the grandstanding Congressfolk to ask about their views on recent volatility in the Treasury market.
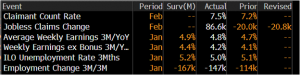
The UK employment data is already out. It was generally better than expected, with unemployment falling, not rising as forecast, and the loss of jobs less than had been expected.
So now we have to wait a while until we get the US current account, which in any case isn’t that big a market-mover, but I like to watch the trade data anyway as I remember fondly back in the days when it mattered for FX. The current account deficit is expected to widen further.
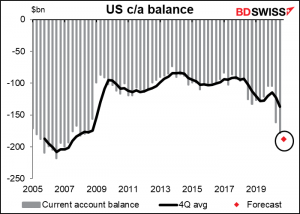
Will people start worrying again about the dreaded twin deficits, which used to dominate discussion in the FX markets? Given the enormous budget deficits the US has been running, if they were to start thinking about this problem again, the dollar would be like those Alcapulco cliff divers we used to see on TV many years ago (although maybe I should be referencing the Red Bull cliff diving championships, which may be more familiar to readers nowadays).
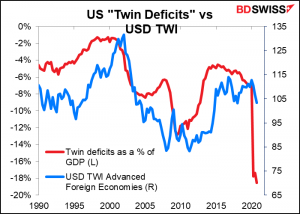
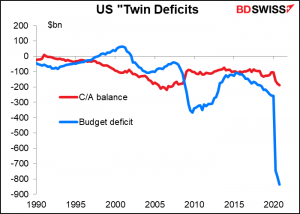
The two deficits used to be of more or less the same magnitude, but now the budget deficit is so much bigger than the current account deficit as to make the concept irrelevant, I think. (The difference is even more pronounced than it appears in the graph because I’m using a smoothed version of the US budget deficit to remove seasonal fluctuations. The actual deficit for Q2 2020 was $2tn, which is more than 10x the current account deficit.)
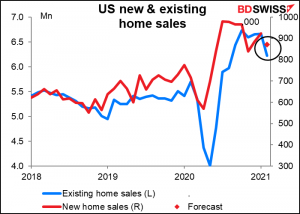
US new home sales are expected to fall by 5.2% mom. This compares with yesterday’s 6.6% decline in existing home sales, much weaker than expected. The market was looking for 6.49mn existing home sales (annualized pace) but it turned out to be only 6.22mn. The problem though seems to be not enough houses for sale rather than not enough buyers – the number of homes for sale fell by a record 29.5% yoy and the median selling price rose 15.8%, so clearly there is still demand. With higher asking prices and mortgage rates rising there may be some fall in demand, though.
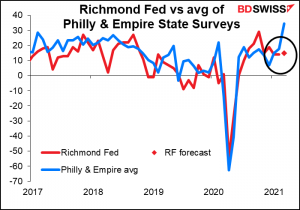
The Richmond Fed survey is expected to tick up a modest 1 point. This would be a dull performance indeed. The Empire State manufacturing index was up 5.3 points and the Philly Fed business index leapt an astonishing 28.7 points (vs the tiny 0.2-point rise that was expected). While the market puts more weight on the Empire State and Philly Fed indices – probably because they come out earlier – the Richmond Fed survey is the one that best predicts the Institute of Supply Management (ISM) purchasing managers’ index (PMI), according to my research. The ISM is one of the most important monthly indicators and so I pay attention to the Richmond Fed index.
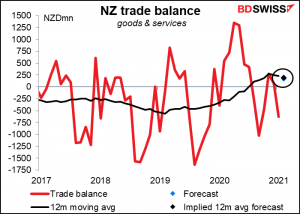
Then overnight we get the New Zealand trade figures. The data aren’t seasonally adjusted so I prefer to look at the implied 12-month average. That’s expected to come down slightly to NZD 198mn from NZD 229mn, continuing the gentle decline we’ve seen since the surplus peaked in November. That could add to the downward pressure on NZD.
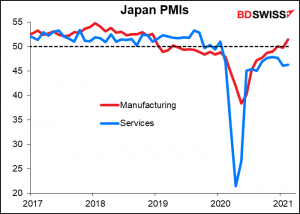
The NZ data is followed by the first of the preliminary purchasing managers’ indices (PMIs) with the Japanese PMIs. As usual, no forecasts. Japan’s manufacturing PMI finally poked its nose over the 50 “boom or bust” line in February, but the service-sector index has struggled and fallen back without ever hitting the magic number.
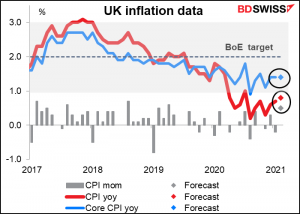
Then another early-morning UK indicator, this time UK inflation data. The figures are forecast to show headline inflation nudging up slightly but still below the Bank of England’s band of tolerance. This certainly would not qualify as “significant progress” toward “achieving the 2% inflation target sustainably” and so wouldn’t give the Bank of England any reason to reconsider its stance.
Source: BDSwiss