Rates as of 05:00 GMT
Market Recap
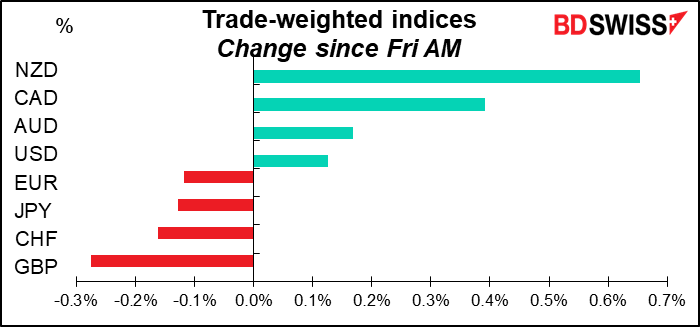
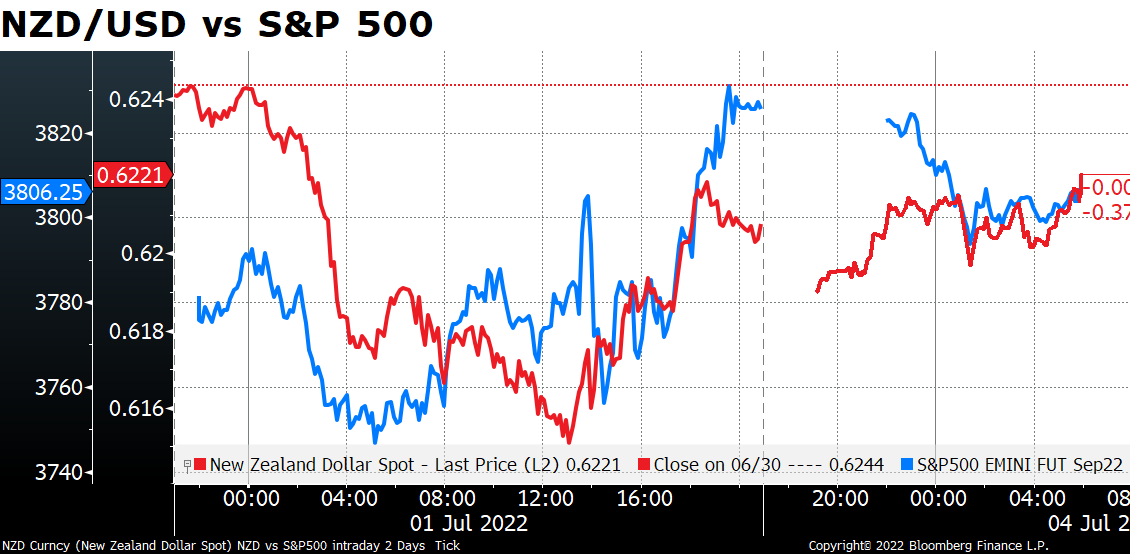
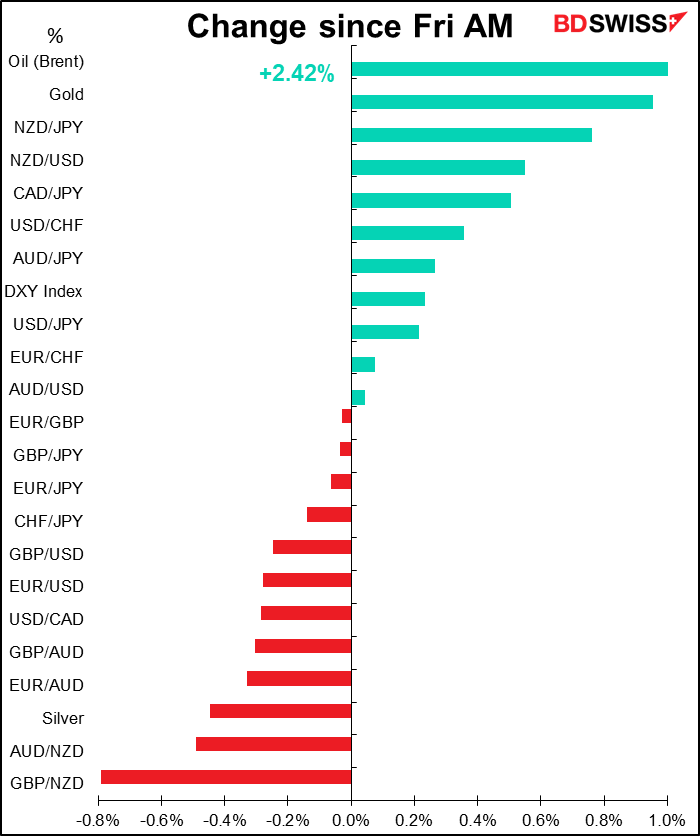
NZD was the clear winner today but it’s hard to explain why. The currency was plunging on Friday morning when I took the rates and continued to plunge during the day, with both NZD and AUD hitting two-year lows during the day. But then NZD recovered for some mysterious reason – perhaps just a general recovery in risk sentiment, as exemplified by the S&P 500?
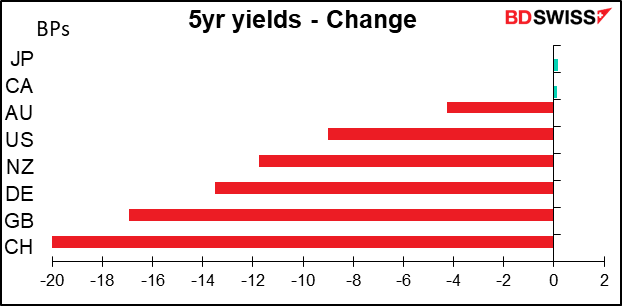
Bond yields continue to decline
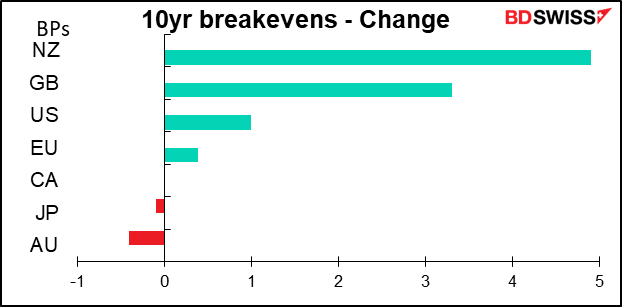
Although inflation expectations were mixed. Inflation expectations rose in New Zealand.
This adds to the mystery of NZD’s outperformance – why was it up so much when NZD real yields were down so much? Especially since the only currency whose real yields fell by more, GBP, was the worst-performing currency.
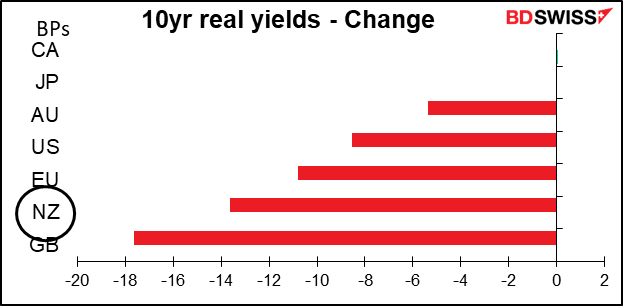
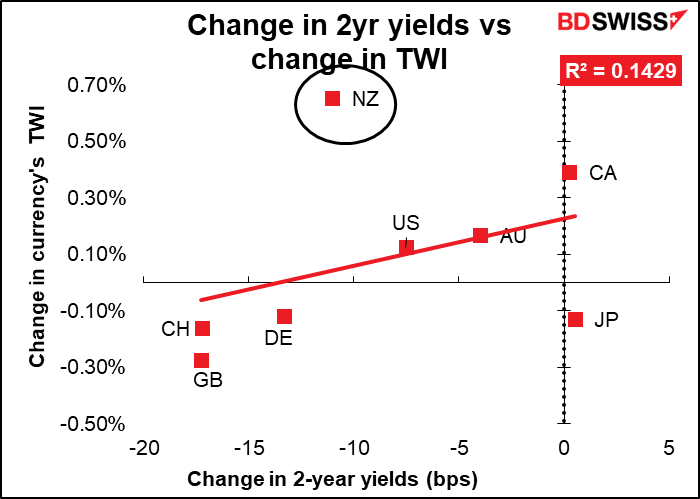
You can see what an outlier NZD was. (The graph for 10-year yields is pretty much the same.)
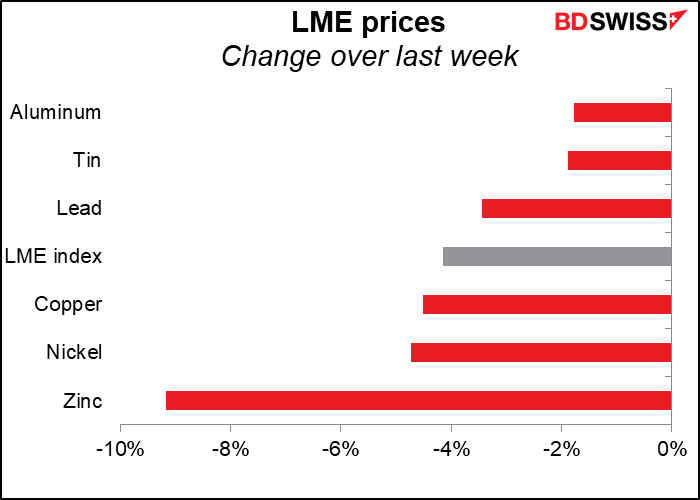
I think one reason might be just people selling AUD chose to use AUD/NZD to express their view. AUD was largely tracking the decline in copper. Copper, often seen as a bellwether of global economic activity, is now down 27% from its peak in early March.
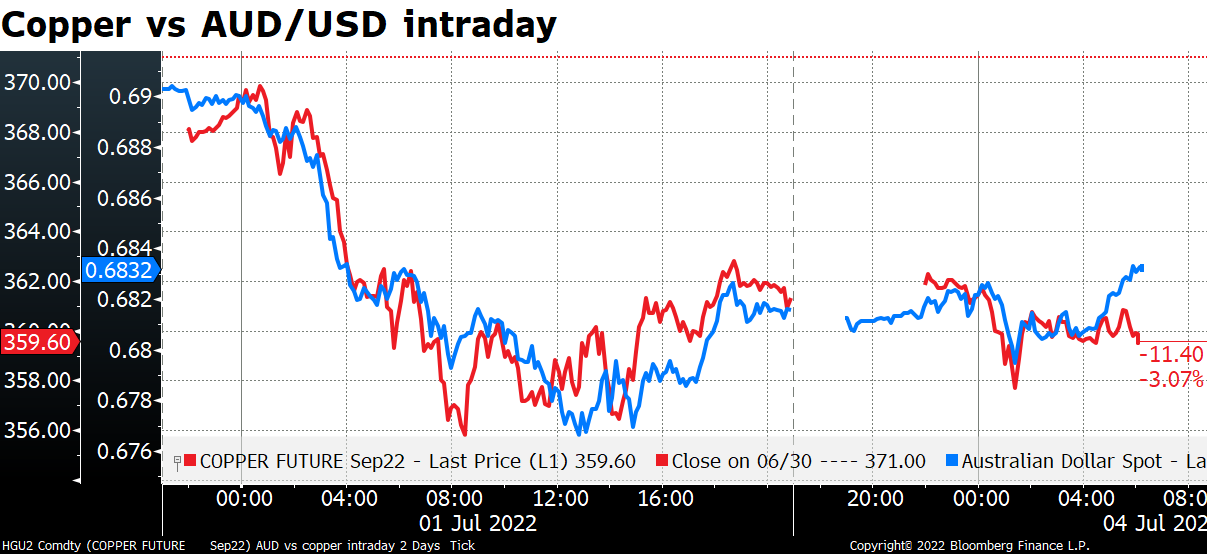
Industrial metals fell last week as investors reassessed the outlook for global growth (as I discussed at length Friday in my Weekly Outlook: Recession risks outweigh tightening fears). In this atmosphere, NZD is likely to outperform AUD because demand for New Zealand’s agricultural commodities is less elastic than demand for Australia’s industrial commodities (people have to eat but they don’t have to buy a new house.)
As for why GBP was the worst-performing currency of the day…do we really need an explanation for that? With not much economic data coming out this week, the focus will be on the general disaster that is UK politics right now.
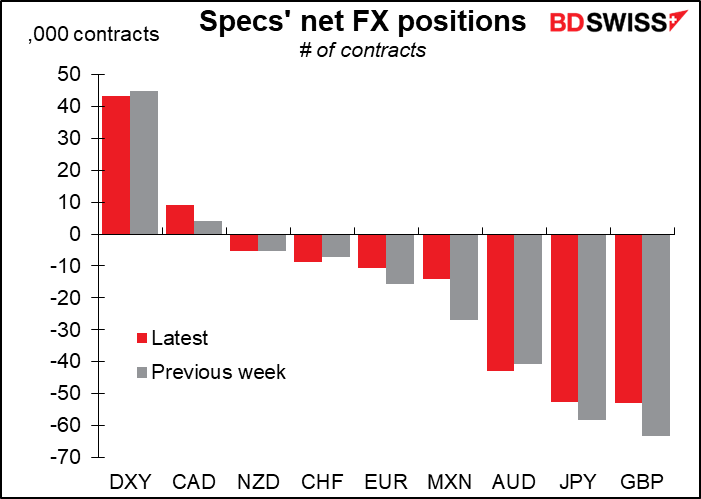
Commitments of Traders (CoT) report
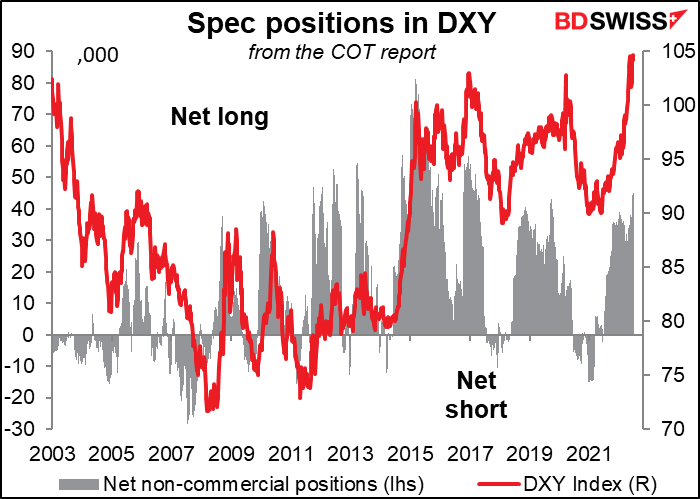
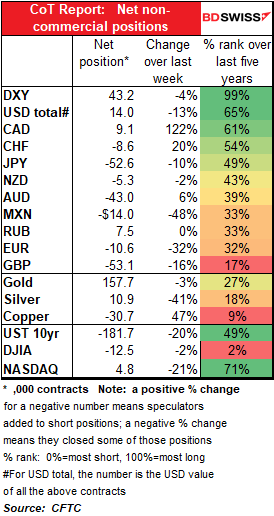
Speculators generally reduced their long USD positions – interesting in that the their long DXY position, which they also reduced, is still near the highest for the last five years. The change came largely by specs trimming several of their short currency positions – GBP, JPY, MXN, and EUR, as well as reducing their long CAD. On the other hand, they increased their short AUD and CHF positions though (oops! Maybe they should’ve left their CHF positions alone.)
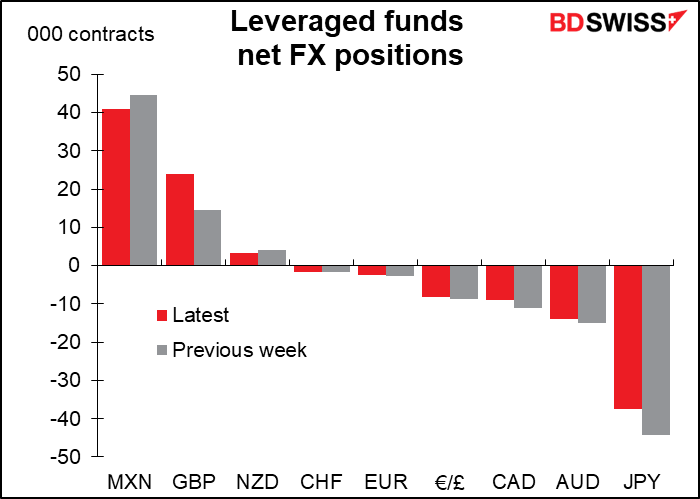
Hedge funds trimmed their short JPY and long MXN while adding to their long GBP positions. They remain short CHF & EUR.
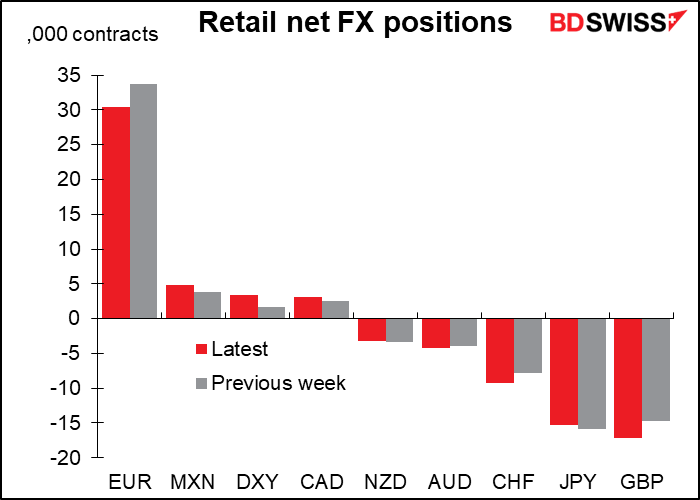
Retail traders cut their long EUR positions significantly, although they remain quite long. They added to their short GBP and CHF positions (a lot of people have missed the move in CHF!)
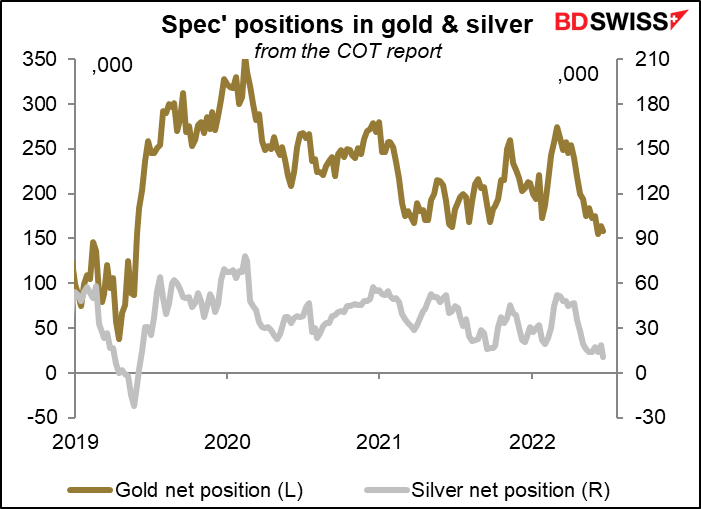
Precious metals: Speculators cut both their long gold and silver positions.
Today’s market
Note: The table above is updated before publication with the latest consensus forecasts. However, the text & charts are prepared ahead of time. Therefore there can be discrepancies between the forecasts given in the table above and in the text & charts.
With the US on holiday today (Happy 4th of July! The holiday that dogs hate (because it’s generally accompanied by fireworks)) it’s likely to be relatively quiet, unless you happen to be at a beach in the US.
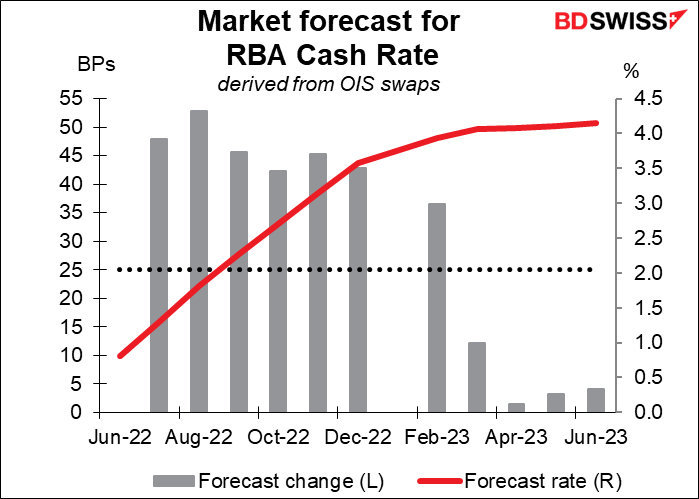
The major item of interest over the next 24 hours will be the Reserve Bank of Australia (RBA) meeting. I said virtually everything I could think of saying about this in my Weekly Outlook, so I’ll just recapitulate the major points here, which are that the market is pricing in a 50 bps hike at both this meeting and the next meeting, with a good chance of 50 bps hikes at every meeting for the remainder of the year.
The next question is, what changes will they make to their forward guidance, if any? I’d expect them to keep their existing vague guidance unchanged. It reads:
The Board expects to take further steps in the process of normalising monetary conditions in Australia over the months ahead. The size and timing of future interest rate increases will be guided by the incoming data and the Board’s assessment of the outlook for inflation and the labour market. The Board is committed to doing what is necessary to ensure that inflation in Australia returns to target over time.
They may choose to point to the Q2 CPI release on July 27th as a possible trigger point. In the May Statement on Monetary Policy (SMP), they forecast that headline inflation would be 5.5% yoy in June, but by Q1 it was 5.1% already. If Q2 inflation prints much higher than expected, then the RBA might go for a 75 bps hike in August. I expect that they’ll want to keep their options open. Retaining the possibility of a 75 bps hike could be positive for AUD.
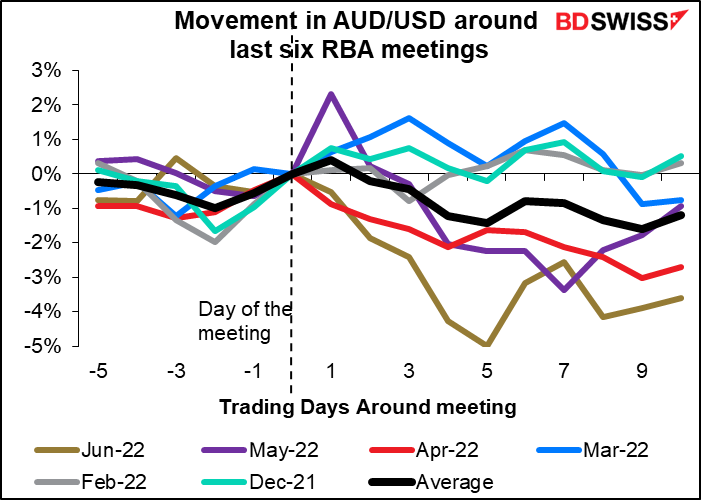
However, I have to admit that so far, the RBA has managed to underwhelm the market. Four out of the last six meetings, AUD/USD has fallen in the days following the meeting, which suggests that maybe, just maybe, the currency is likely to weaken afterward.
This chart is somewhat – no, I have to admit – largely disingenuous, because four out of six times the RBA was on hold. The only times that truly matter are the last two (May and June), when the RBA did hike rates. Note that AUD fell in June and while it initially rose in May, it began falling a day or two later.
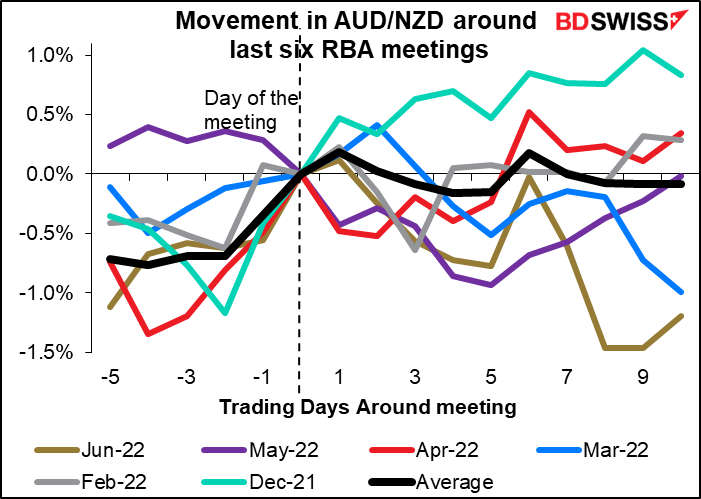
Same thing (pretty much) for AUD/NZD, although on average it was pretty much unchanged. But that may be because of Dec ‘21’s large movement distorting the average.
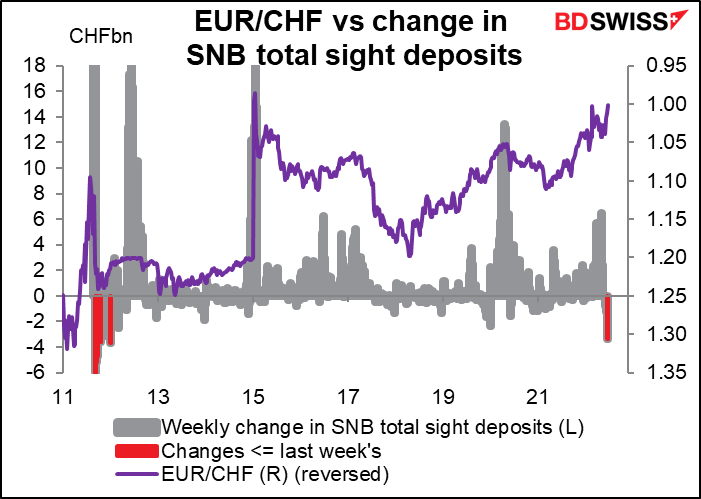
As for the day’s indicators, we start as usual on a Monday with the Swiss sight deposits. They’ve fallen for five weeks in a row, each week by more even as EUR/CHF approached (and last week finally broke through intraday) the magical 1.0000 number. Last week’s change was the 6th largest decline ever (data back to August 2011) and the largest since Dec 2011. It’s clear that the Swiss National Bank (SNB) is hastening the pair’s decline.
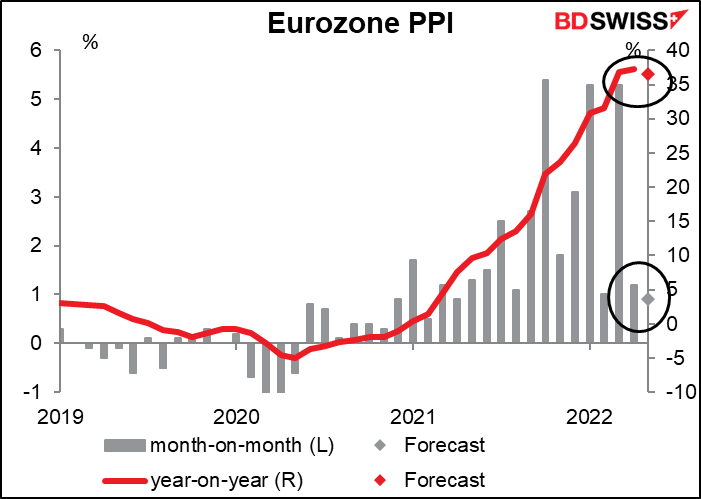
The Eurozone producer price index (PPI) is expected to edge down a bit, but I doubt if that will be of any solace to anyone. It’s still extraordinarily high.
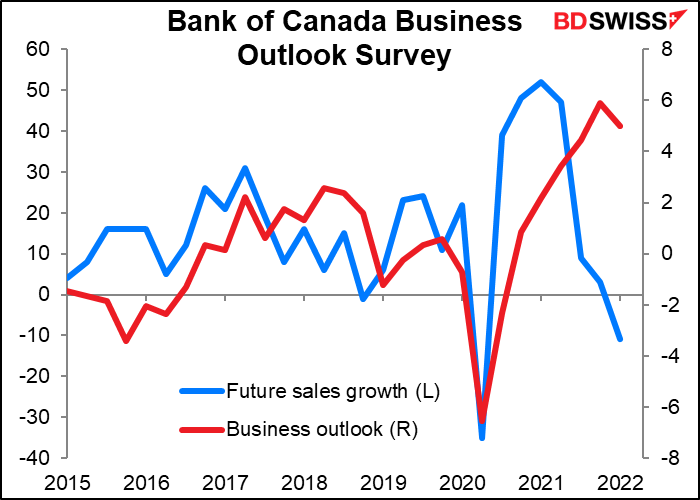
There are no forecasts for the Bank of Canada business outlook survey but the Bank of Canada no doubt looks at it, otherwise why would they do it?
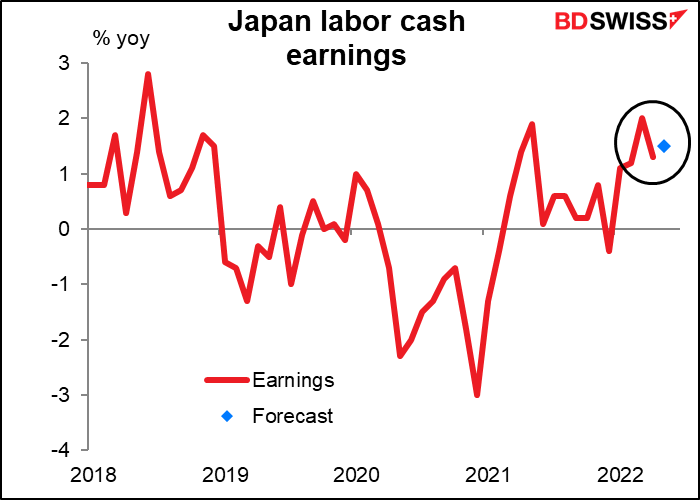
Overnight in Japan, we get the labor cash earnings, which I also discussed at length in my Weekly Outlook. This indicator isn’t that important nowadays but could start to be as public perception of inflation heats up and people start demanding higher wages. Having said that, the market is looking for an increase of only 1.5% yoy, which would be in line with the recent trend and not indicate any great acceleration due to higher inflation expectations. That could be negative for the yen.
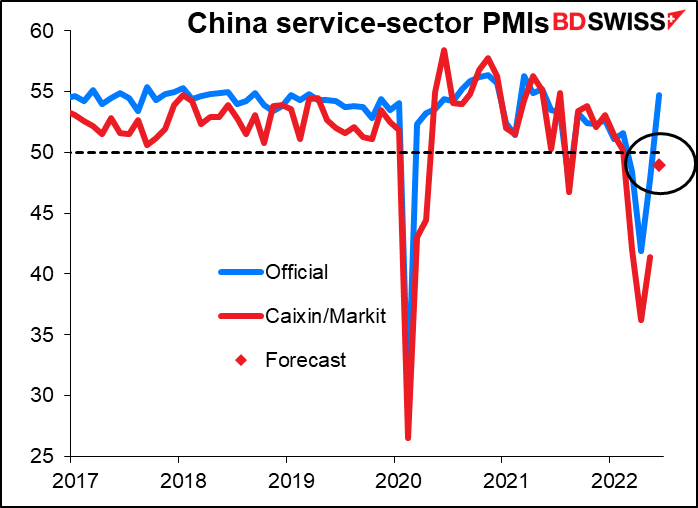
After that we start to get the service-sector purchasing managers’ indices (PMIs), the final ones for countries like Japan that have preliminary versions and the one-and-onlies for countries like China that don’t have preliminaries. China is expected to rebound considerably but not be able to poke its nose over the 50 “boom-or-bust” line even though the official PMI did. (I think the official PMI does a better job than the Caixin/Markit version does, but that’s just my view.)
Source: BDSwiss