Rates as of 05:00 GMT
Market Recap
It’s pretty amazing that confidence keeps rising and stock markets keep going up (the S&P 500 hit its 70th record high this year) even as the virus situation just gets worse and worse. The world achieved a new milestone yesterday: over 1mn new cases a day (7-day moving average). 1,041,974 to be exact, according to the data I have. That’s up 47% in a week!
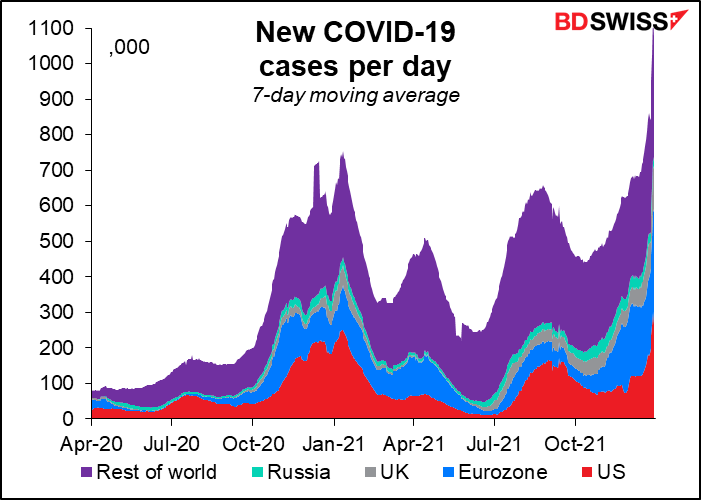
And frankly I don’t believe these numbers, because China is reporting just 200-300 new cases a day. Really? When tiny Cyprus reported 3,002? I know they take Draconian steps when they do find even one case, but it’s a huge country, I can’t imagine they can catch everyone.
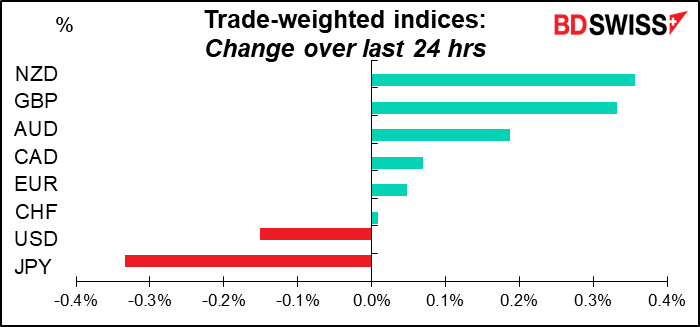
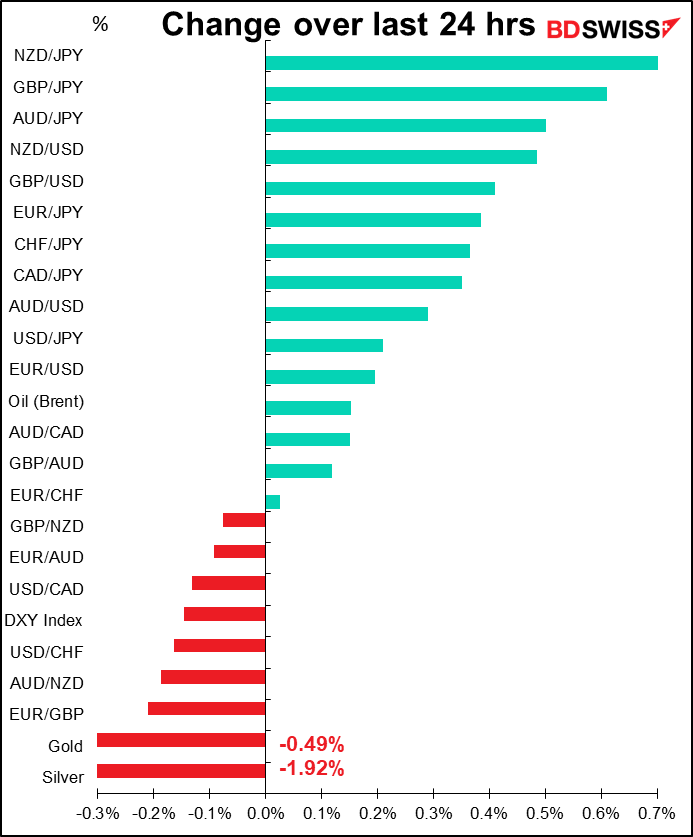
As for the FX market, Bloomberg attributes the performance of GBP to movements in the gilts market. It’s true that five-year Gilt yields did move higher.
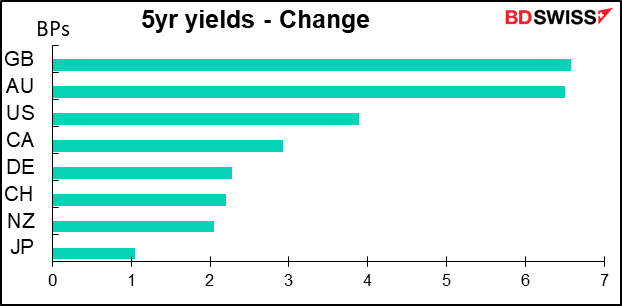
And with five-year UK breakeven inflation rates moving lower, the improvement in five-year real Gilts yields stood out even more.
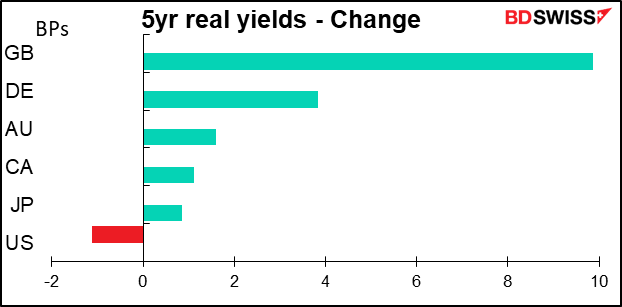
Meanwhile, the fall in US real yields would explain in part the dollar’s poor performance. US nominal yields were up but breakeven inflation rates rose even more. Also the general “tisk-on” tone, which put downward pressure on the safe-haven JPY as well as the dollar, was no doubt a factor here too.
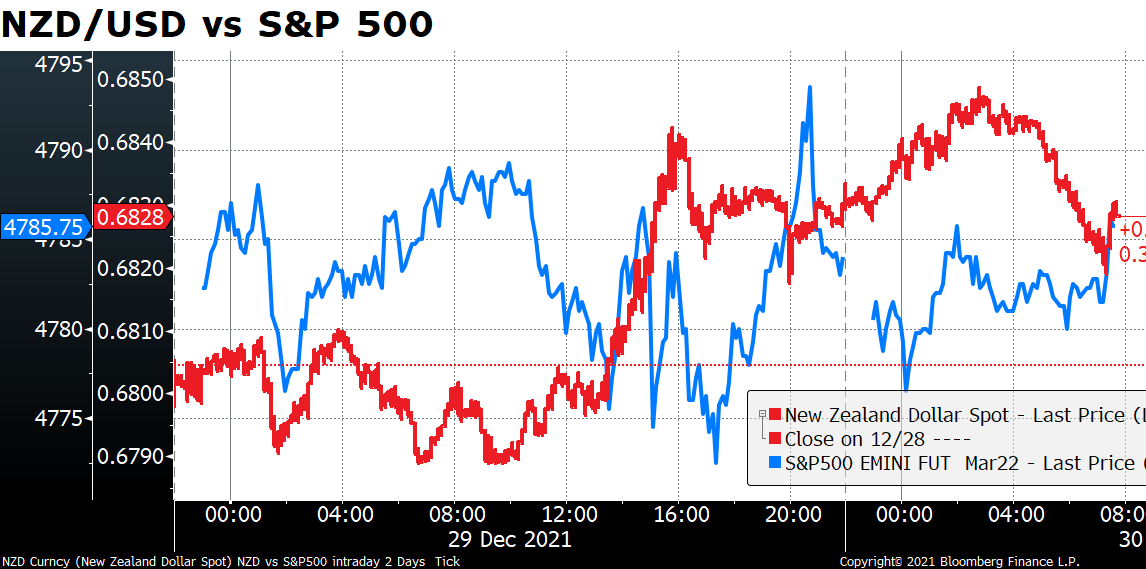
That doesn’t explain though why NZD was the best-performing currency even though its yields rose very little. The comment on Bloomberg, which costs $2,250 a month, was not particularly helpful: “NZD/USD trades little changed at 0.6827 after rising 0.4% Wednesday.” However since they never explain why it rose on Wednesday, I’m left none the wiser. I thought maybe it was risk sentiment, but as you can see there wasn’t that strong a connection between NZD/USD and the S&P 500 yesterday.
Aha! If we track NZD/USD vs the West Texas Intermediate (WTI) crude oil contract, we get a much better fit. It looks like NZD followed oil higher, which is strange since New Zealand is hardly a major oil producer. On the contrary, it produces about 44k barrels a day and consumes 167k b/d, so it’s a net importer, not exporter, and therefore loses out when oil prices go up. But apparently the FX market thinks “commodities” and doesn’t discriminate among commodities. Most of New Zealand’s exports are food or other agricultural products (e.g. wood).
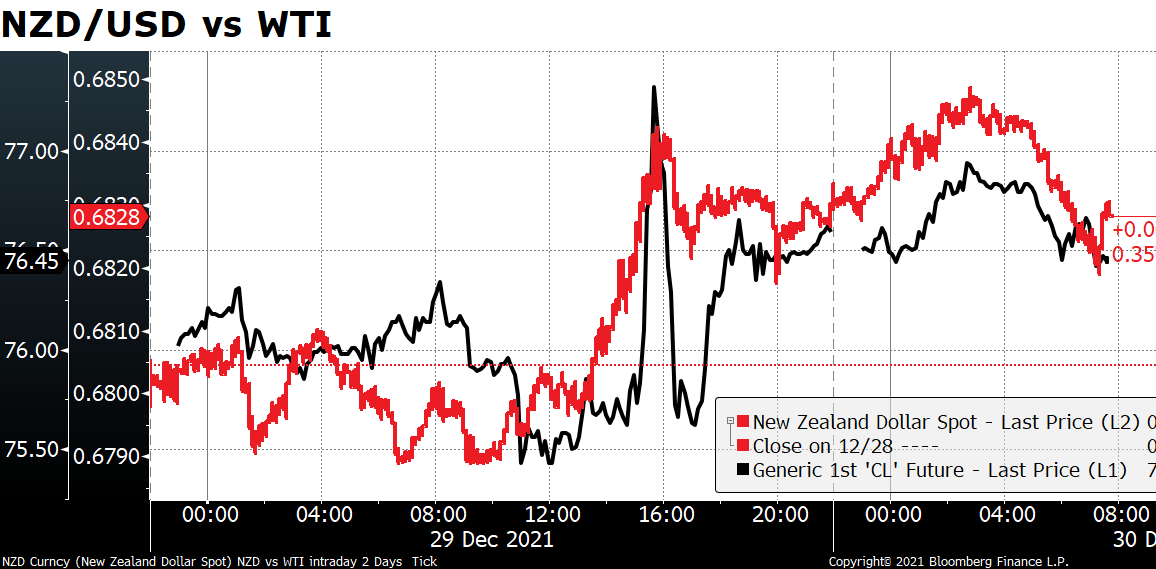
It’s true though – I’ve looked at the correlation between NZD/USD and all the various Bloomberg commodity sub-indices and the only statistically significant relationships were with the energy index and, oddly enough, the overall index excluding energy. (There is a significant relationship with industrial metals but with the sign in the wrong direction.) Not so fast though: when I ran another test using only the agricultural indices, the relationships were not only statistically significant but also much higher than for the energy index, particularly for the agricultural index overall and for grains. My econometrics isn’t good enough to figure out why that relationship disappears when one looks at all the indices together.
As for why oil rose, you can see from the graph how it popped when the US oil inventory data came out and showed a larger-than-expected drawdown in inventories (-3.6mn barrels vs -2.7mn expected). US inventories continue to be below normal, which is encouraging a scramble for oil.
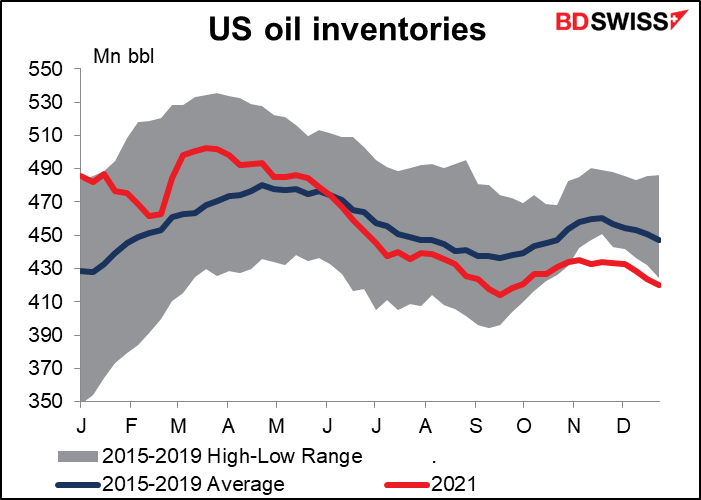
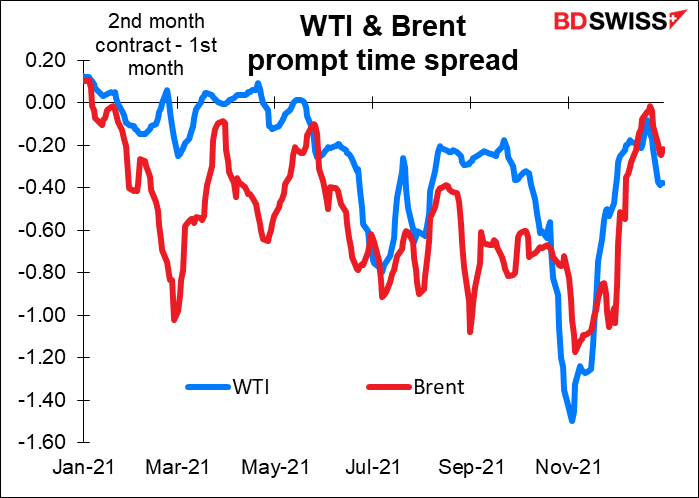
The prompt time spread, the difference between the nearest futures contract and the second-nearest, had almost disappeared but has started to widen again recently. This indicates growing pressure to get oil ASAP. It’s a bullish sign for oil.
US virus problems
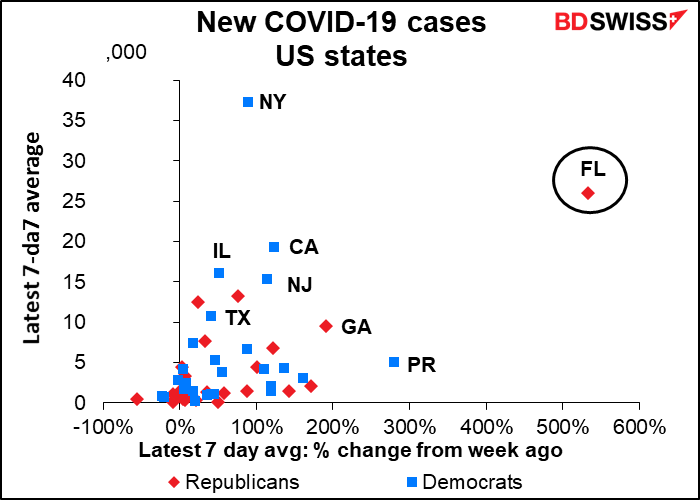
Yesterday I mentioned the problems that the US is likely to have due to the virus. Here’s a snapshot of where things stand now. Out of the 52 states and territories (including Washington DC and Puerto Rico)), 44 have seen an increase in cases over the last week. Of these, 22 are up more than 50% and 14 are up more than 100% — in just one week! The leader of the pack is the Republican wonderland of Florida, led by the Jim Jones of governors, Ron DeSantis, who is going all-in on refusing any steps to mitigate the virus. Cases there are up 532% over the last week!
(DeSantis isn’t doing this out of ignorance. He hopes to be the Republican candidate for President in 2024. He certainly noticed that none other than the Orange Menace himself was booed when he said people should get vaccinated.)
The virus is causing increasing problems in cities. For example, one of New York’s subway lines was out of order – a lot of transit workers are out sick.
So far this is concentrated in the urban centers, but it no doubt will quickly spread to the more rural areas, where fewer people are vaccinated. Then…watch out.
It’s ironic that the same people who are refusing to get vaccinated are also blaming President Biden for the spread of the virus. If one were given to believing conspiracy theories, one might imagine that perhaps the leaders of the Republican Party were purposely encouraging the party faithful not to get vaccinated so that the virus would spread and the Democrats would get blamed, even if it cost the death of their own followers (although not the party leaders themselves, who are all vaccinated themselves). But I’m not so cynical as to believe someone would really do that.
More “unknown unkowns”
Boy this is one I didn’t have on my radar screen at all.

According to The Cooperative Institute for Research in Environmental Sciences at the University of Colorado Boulder:
Antarctica’s Thwaites Glacier is retreating rapidly as a warming ocean slowly erases its ice from below, leading to faster flow, more fracturing, and a threat of collapse, according to an international team of scientists. The glacier is the size of Florida or Britain and currently contributes four percent of annual global sea level rise. If it does collapse, global sea levels would rise by several feet—putting millions of people living in coastal cities in danger zones for extreme flooding.
Today’s market
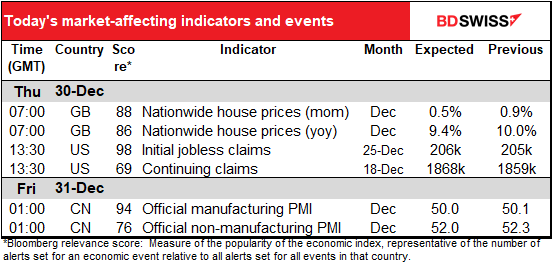
Note: The table above is updated before publication with the latest consensus forecasts. However, the text & charts are prepared ahead of time. Therefore there can be discrepancies between the forecasts given in the table above and in the text & charts.
I already covered the UK Nationwide house prices yesterday. In the event, they were up 1.0% mom, double the expected rate of increase. This is pretty good when you consider how much housing activity the tax stamp holiday, which ended at the end of June, must have brought forward. Houses in the UK do seem to be a one-way bet. Why didn’t I buy the garden flat beneath me when I lived in Hampstead in the 1980s? I could be living off the rental income from that now.
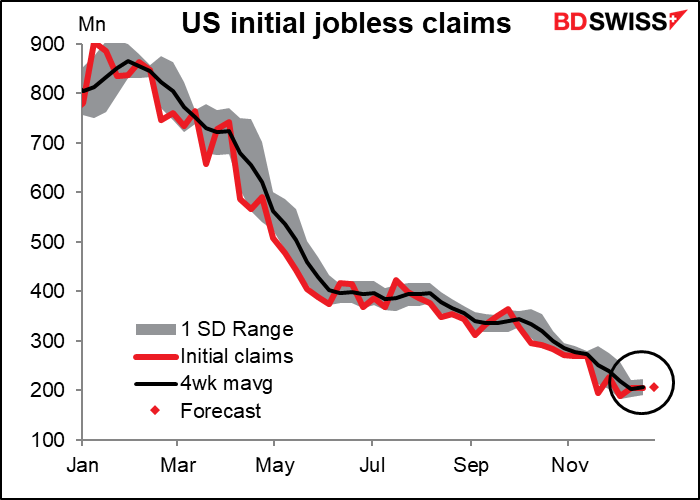
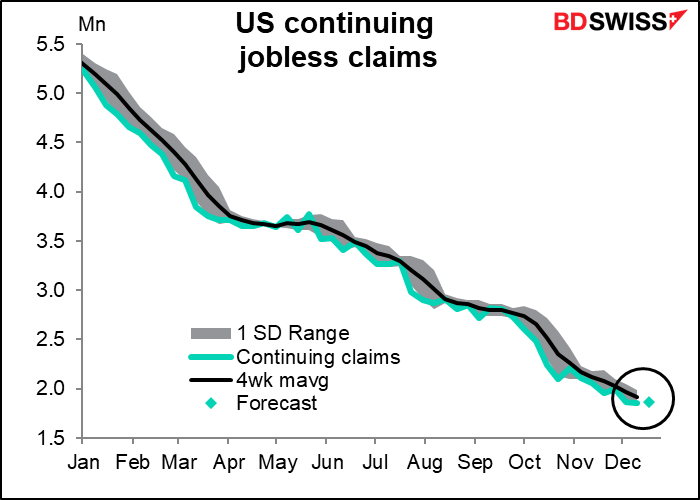
So that’s about it until the US opens up and we get the weekly US jobless claims, which continue to be of interest even though they’ve now fallen back to normal levels – indeed, down to record-low levels when adjusted for population.
Claims were little changed last week – initial claims were unchanged and continuing claims down a mere 8k – and are expected to be similarly stable this week. Maybe that’s because the kindly folk who run companies want to make sure that all their employees can enjoy a tranquil and secure Christmas with their families with no financial worries. Hahaha! Just joking! It’s because the quit rate is still running at a near-record high and there’s 1.49 jobs out there for every unemployed person.
And that’s about it!
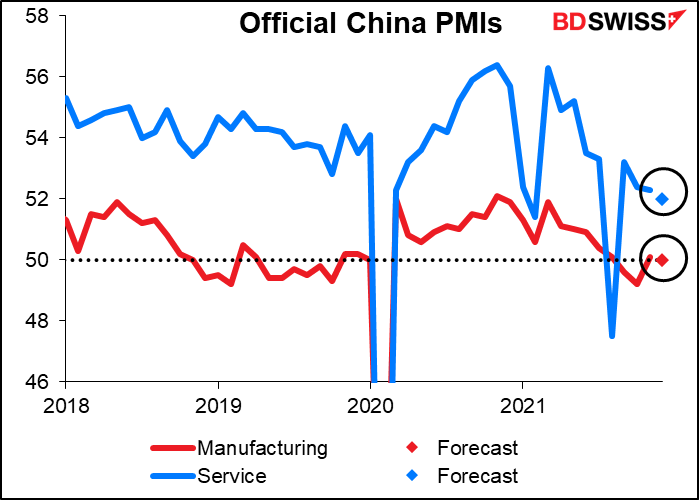
Overnight we get the China official purchasing managers’ indices (PMIs). China has two sets of PMIs: one compiled by Markit and an official one compiled by the China Federation of Logistics and Purchasing in collaboration with the National Bureau of Statistics. The Caixin/Markit PMI surveys more than 420 firms while the official one surveys some 3,000 companies.
The two often give different readings. This can be attributed to the different coverage: the Markit/Caixin survey not only covers far fewer companies, but most of them are smaller, privately owned firms, while the official survey includes many more of the large state-owned enterprises. Furthermore, the companies that Caixin surveys are concentrated on the booming East coast, while the official survey has a much more even national coverage.
Both the manufacturing and service-sector PMIs are expected to be down slightly, which wouldn’t be surprising as China has also suffered from further lockdowns, not to mention existing bottlenecks and supply chain difficulties. The manufacturing PMI is expected to be sitting right on the dividing line between contraction and expansion. Given the problems facing many export markets, it’s likely to tip over into contraction next month. That would be negative for AUD and NZD.
Source: BDSwiss