Note: The table above is updated before publication with the latest consensus forecasts. However, the text & charts are prepared ahead of time. Therefore there can be discrepancies between the forecasts given in the table above and in the text & charts.
Rates as of 05:00 GMT
Market Recap
Not quite as “risk-on” as it was yesterday; the US stock markets were closed for a holiday, and one or two markets globally (not many more) were down slightly. But still the “risk-on” mood continues as equity indices around the world move further into record territory thanks to optimism on the vaccine rollout and the increasing likelihood that the US will pass President Biden’s full $1.9tn stimulus package.
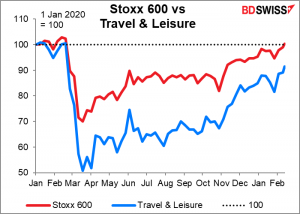
In Europe, Germany’s DAX ( 0.4%) hit a record high yesterday, while the STOXX 600 ( 1.3%), the CAC 40 ( 1.5%) and the FTSE MIB ( 0.8%) all hit their highest levels since the pandemic began. Vaccine hopes sent the STOXX 600 Travel & Leisure index up 2.7%.
As I mentioned yesterday, Japan’s Nikkei closed above 30,000 for the first time since 1990 and this morning is up a further 1.3%, while Hong Kong came back from vacation and pushed the Hang Seng up 1.7%. And equity futures are pointing towards yet more all-time highs in the US, with S&P 500 futures up 0.6%.
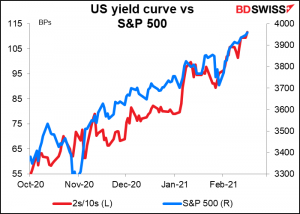
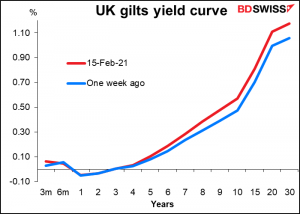
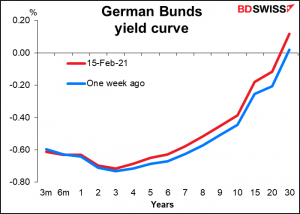
With stock markets soaring, bond yields also rose – US 10-year yields 2.3 bps – and the yield curve steepened further. Yields moved higher across Europe too, with German Bunds yields rising to their highest level since June and UK Glits to their highest level since last March. The yield curve steepened in both those markets, too. Italian yields kept pace with Bunds as the markets welcomed Super Mario’s installation as Prime Minister on Saturday.
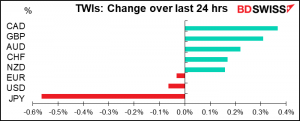
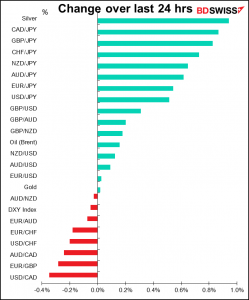
Higher yields didn’t support the dollar however as USD and JPY both fell while the commodity currencies rose. This is a good example of how JPY Is often moved more by risk sentiment than by Japanese economic indicators, which have been beating estimates recently (today’s tertiary sector index came in at –0.4% mom vs -0.6% expected, not to mention yesterday’s better-than-expected GDP figure).
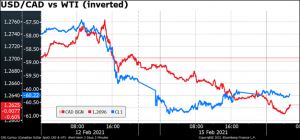
CAD was the main gainer as snow blanketed much of the US and energy prices rose. CL1, the blue line in this graph, is the nearest future contract on West Texas Intermediate (WTI), the benchmark US crude oil. It’s inverted to show the connection with USD/CAD, which falls when CAD strengthens.
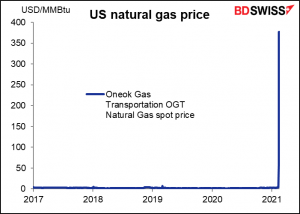
I want to apologize to everyone for not spotting the tremendous opportunity in natural gas thanks to the cold snap in the US. This is a graph of the price of natural gas delivered to the intrastate pipeline in Oklahoma. From 2017 until this year it averaged $2.03 per million BTUs, ranging from $0.85 to $7.06. It traded Friday at $377.13, vs $3.46 a week earlier.
Today’s market
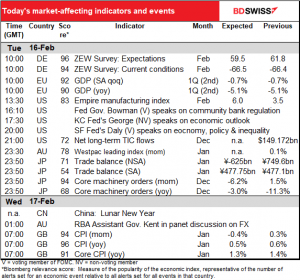
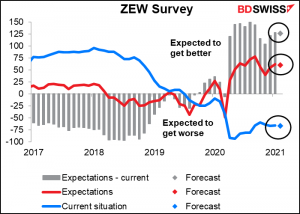
The day starts with the ZEW survey of opinions by economists, analysts and other such observers, not to be confused with the purchasing managers’ indices, which ask questions of people who actually do things. The ZEW is more of a sentiment index than a gauge of economic activity. And sentiment is expected to worsen slightly. The “current situation” index is expected to be more or less unchanged, but the “expectations” index is forecast to come down a bit – no doubt due to the extended lockdown in Germany.
The second estimate of EU-wide Q4 GDP is likely to be of little interest – it’s rarely revised, and when it is, it’s normally just ±10 bps so nothing major.
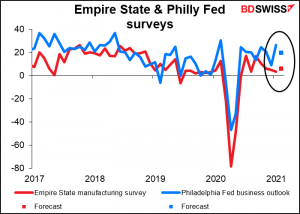
Then we wait for the US day to start up and the Empire State manufacturing survey from the great state of New York. Nice place to live generally speaking but, I wouldn’t want to be in a nursing home there over the last year. The Empire State survey is expected to be up a bit while Thursday’s Philly Fed index is expected to be down a bit. Both are forecast to show continued expansion in the US but at a low(er) level.
Then there are three Fed speakers in a row. Fed Gov. Bowman is the representative for community banking and probably won’t have a lot to say about monetary policy, which isn’t her forte.
Note that San Francisco Fed President Daly is speaking on the economy, monetary policy, and inequality. The latter is a topic we never heard much about from the Fed (or indeed any central bank) before last year, but now is a hot topic among Fed Governors and regional Presidents. That’s one reason I’m bearish USD: I think the Fed is committed to using the power of monetary policy to right some of the structural wrongs in the US economy. (Note that being bearish on the currency because of this doesn’t mean I think it’s the wrong thing to do, by any means.) That’s going to take a long long time to achieve and probably means keeping interest rates significantly loose for a long time.
In his speech last week, “Getting Back to a Strong Labor Market,” Fed Chair Powell pointed out that many of the benefits that a strong labor market can deliver “only arose toward the end of the previous expansion,” when unemployment was near a 50-year low. That implies he hopes to drive unemployment back down to those levels. Good luck! I wish him every success in this endeavor. It’s going to take time and significant stimulus. A weaker dollar might help by making exports more competitive and encouraging companies to onshore their manufacturing.
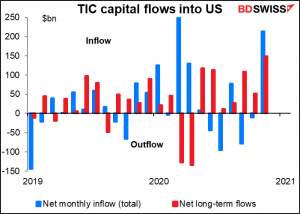
There’s no forecast for the Treasury International Capital (TIC) data on capital flows into and out of the US, and it’s hard to draw a connection with USD movements. More to the point as the data is already 1 ½ months old, it’s hard to draw any lessons for future movements from the data, unless we assume that the past trend will continue unabated into the future, which is a pretty reliable way to be wrong.
The trend recently has been for long-term money to flow into the US, but overall for the flow to be flat, meaning a lot of short-term money must be leaving the country.
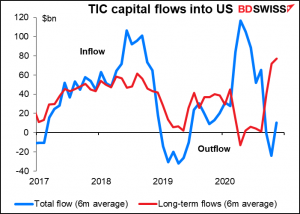
Looking at the data for purchasers & sellers by country, we see that the biggest sellers have been in the Caribbean. This isn’t Captain Jack Sparrow making a synthetic long gold position by going short Treasuries, but rather hedge funds (and perhaps some Japanese investors too) shorting the market. I would wonder about the net impact of this on the currency market though, because if this is US hedge funds, then it’s likely that somewhere else buried in the balance of payments there’s a matching and offsetting inflow of bank deposits.
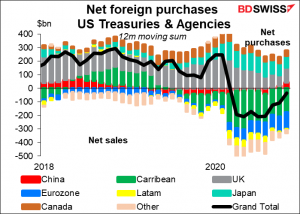
Net net, the TIC data is interesting to inform your view of the market and adds to our understanding of what happened. It may also help us to understand how economic actors react to recent conditions. It’s not necessarily going to enable us to forecast the markets, however.
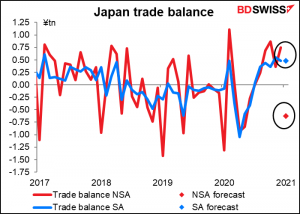
Overnight we have the Japan trade figures. There’s a big difference this month between the seasonally adjusted data, which is expected to be little changed from the previous month, and the unadjusted data, which is expected to show the trade surplus plunging into deficit. January is habitually the month when the SA figure is the highest relative to the NSA figure (looking at the median percentage difference between the two back to 2005). That probably has to do with the New Year’s holiday, which disrupts shipping – somehow more ships can unload than can sail off, hence imports habitually rise more than exports. The market focuses on the NSA figure for some bizarre reason, but as long as it comes in close to estimates it shouldn’t cause any waves.
This month is probably a bit harder to forecast than usual, because this year’s Chinese New Year started later than usual (Feb. 11th). Last year it started on Jan. 24th. The seasonal adjustment can’t take this floating holiday into account and so the figures could be distorted.
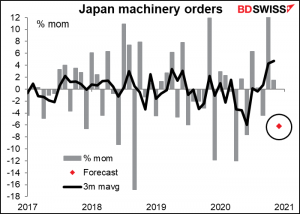
The Japan machinery orders figure is probably more important though, although I can’t for the life of me figure out why. These figures are closely watched as an indicator of Japan’s capital investment, but they’ve always seemed to me to be too volatile to extract a trend out of.
In any case, this month’s figure is expected to plunge after two strong months (up a sharp 17.1% mom rise in October and rising further in November too). The market’s forecast of a 6.2% mom decline would still allow the three-month moving average to be positive ( 4.1% vs 4.7% in November).
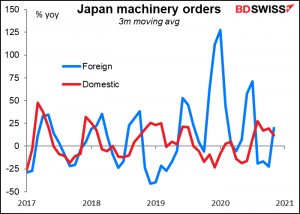
I’m not clear why – both foreign and domestic orders have been growing at about the same pace.
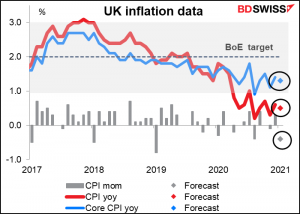
Then early in the European morning, as the ravens wake up at the Tower of London and tuck into their breakfast of raw liver, lambs’ hearts and beef or pork trimming (ess gezunterhait, as my grandmother would say – eat it in good health), the UK inflation data comes out. The continent saw a sudden jump in inflation in January, but Britain is expected to see the opposite – a sharp drop in the mom rate of inflation and slow yoy rates for both headline and core. That’s kind of odd considering how oil prices rose in January. It’s probably due to the lockdown in January and the resulting downward pressure on service prices. Any decline in prices is not likely to influence the Bank of England’s Monetary Policy Committee however as they said after their recent (Feb. 4th) meeting that “CPI inflation is expected to rise quite sharply towards the 2% target in the spring, as the reduction in VAT for certain services comes to an end and given developments in energy prices.” It should therefore be neutral for GBP.
Source: BDSwiss