Rates as of 06:00 GMT
Market Recap
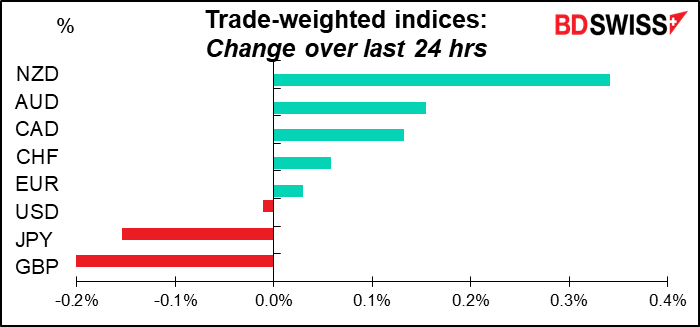
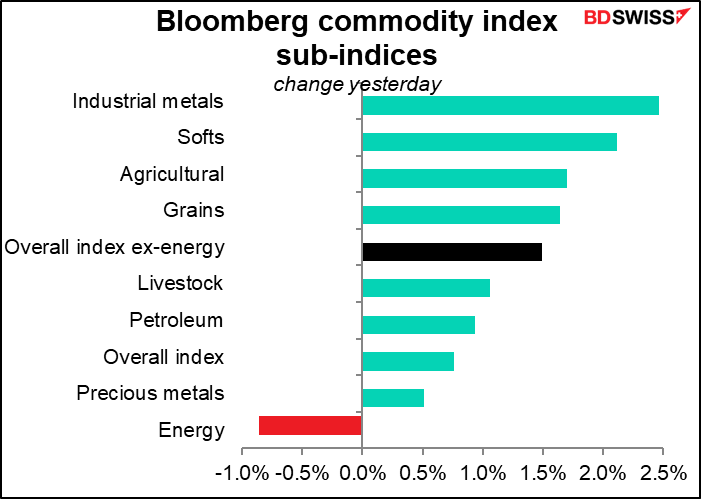
A generally “risk-on” feel in the markets, with most European and US market indices rising yesterday (Euro Stoxx 50 1.8%, S&P 500 1.5%, NASDAQ 2.1%) and higher commodity prices pushed the three commodity currencies higher yesterday and the safe-haven JPY & USD lower (USD just a little).
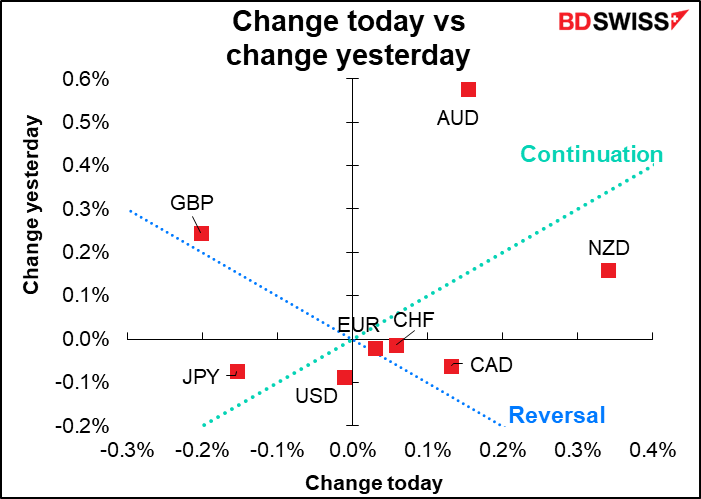
It’s an interesting question why under these conditions, when industrial metals rose by more than agricultural commodities, did NZD outpace AUD. Oddly enough, NZD has a slightly higher correlation to the Bloomberg industrial metals index than AUD does (0.563 vs 0.536). That difference isn’t much, but it’s huge relative to the amount of industrial metals that New Zealand exports (virtually none) vs Australia (lots and lots). NZD also has a similarly insignificant lead vs AUD in terms of its correlation with the Bloomberg agriculture index (0.338 vs 0.318), which is just as remarkable seeing as 62% of New Zealand’s exports are edible whereas iron ore & coal alone account for 40% of Australia’s exports.
In other words, it seems that when “commodities” go up, traders don’t bother asking which commodities, they just think “commodity currencies” and buy.
However, AUD is more closely correlated with global risk appetite (aka S&P 500) than NZD is (0.772 vs 0.712). Moreover, AUD/NZD is more closely correlated with iron ore prices than either AUD or NZD (0.283 vs 0.203 and 0.117). And given that iron ore was up either 0.8% (Dailin futures) or 4.8% (Singapore futures) today, that should mean a higher AUD/NZD, not lower. So I would expect AUD/NZD to recover today, based on the historical relationship between these two currencies and other markets.
GBP weakened after Bank of England Chief Economist Pill tried to calm market expectations. He came out in favor of a more measured and data-dependent approach to adjusting policy in which the Bank would wait to see how the economy reacts to each step rather than committing to a set path of hikes. “I worry that taking unusually large policy steps may validate a market narrative that bank policy is either foot-to-the-floor on the accelerator or foot-to-the-floor with the brake,” he said.
Bank of France Governor and ECB Governing Council member Villeroy also pushed back against the market’s pricing of a sharp tightening in policy. He said last Tuesday that there “were perhaps reactions that were very high and too high in recent days.” That may be one reason why EUR had a lackluster day.
In any event, inflation is the focus of market attention nowadays and so today’s US consumer price index will be the star of the show today (see below).
Today’s market
Note: The table above is updated before publication with the latest consensus forecasts. However, the text & charts are prepared ahead of time. Therefore there can be discrepancies between the forecasts given in the table above and in the text & charts.
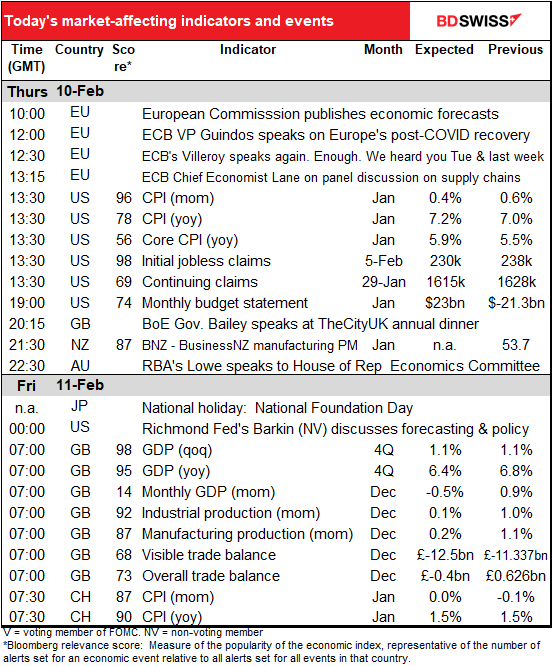
The European day starts out with a number of speeches but nothing major. ECB Chief Economist Lane’s views on how quickly supply chains might get back to normal could be a sign of how long he expects inflation to remain above target, but that’s about it. In the European evening Bank of England Gov. Bailey will be speaking at a dinner and perhaps will dig himself out of the hole he dug last week when he said that people should exercise restraint in wage negotiations – easy for him to say as he’s on over GBP 500k a year. RBA Gov. Lowe will also testify before the House of Representative Standing Committee on Economics, perhaps to explain why he and his pals are keeping rates at the effective zero bound while inflation goes above target.
Then when the US day starts up we get the main headline of the week, the US consumer price index (CPI). In theory this shouldn’t matter as much as the personal consumption expenditure (PCE) deflator, which is what the Fed uses to define inflation, but in practice this is what the market pays most attention to.
It’s expected to be grim: a further rise to 7.3% yoy. It’s not all energy & food either as core inflation is expected to rise further, too.
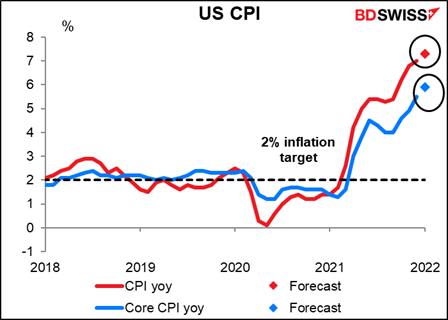
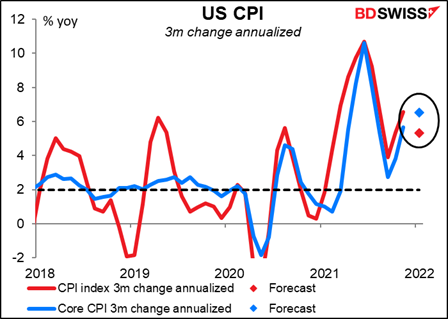
Nor can we blame base effects. If we look at the three-month change annualized to get feel for short-term inflation trends, headline inflation is expected to slow but core inflation is forecast to move even higher.
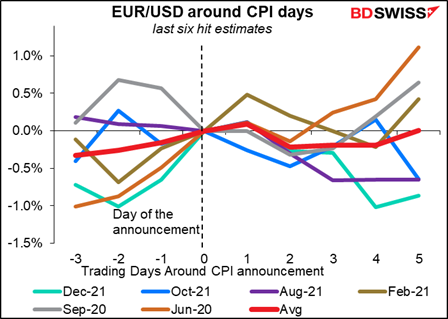
What happens to the dollar after the CPI? The graph gives the average movement of EUR/USD on the days leading up to and after the CPI for the last six times it beat estimates, the last six times it missed, and the last six times it hit. Oddly enough EUR/USD has tended to trend lower (i.e. the dollar has strengthened) no matter whether the index missed or beat estimates! That’s probably because the market afterward decided that even if the figure missed estimates, it was probably high enough to convince the Fed to start tightening eventually.
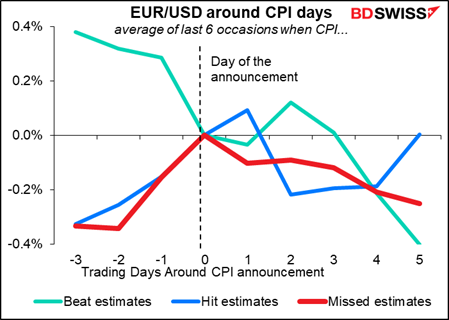
The counter-intuitive rise in EUR/USD on the day following a beat (when normally you’d expect EUR/USD to decline) is largely due to the outsized effect of one month’s data. Otherwise it generally behaved as you’d expect.
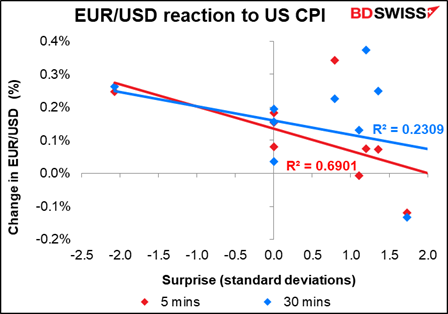
For shorter-term traders, there does seem to be a fairly good correlation between the indicator’s surprise (the difference between the market consensus forecast and the actual) and the subsequent movement of the currency immediately following the release, with the surprise explaining 69% of the movement of the currency in the first five minutes after the release. This difference persists over the next hour as well (not shown).
After this, the next big event for Fed watchers is the release of the minutes of the January FOMC meeting next Wednesday (Feb. 16).
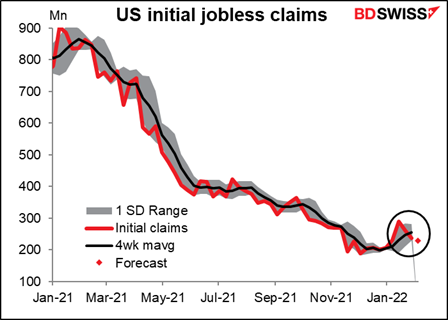
Initial jobless claims have probably lost some of their cachet now that the US is at “maximum employment.” Nonetheless an improvement here – as the market expects – could amplify the impact of a further rise in inflation and push the dollar higher.
That’s it for the US day.
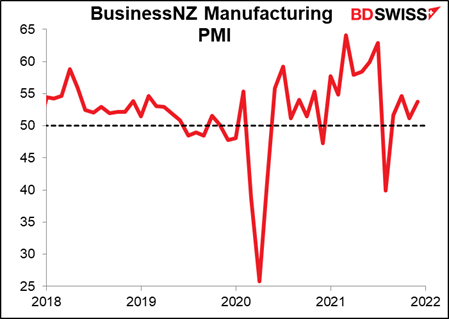
Overnight we get the BusinessNZ manufacturing PMI. There are no forecasts but here’s a graph in case you’re interested. We get so few NZ indicators that I thought I’d throw this one in occasionally.
Today is a holiday in Japan – Foundation Day. The day supposedly commemorates the ascension of the first Emperor of Japan, Emperor Jimmu, there’s no real proof that he even existed much less that he took the throne on this day. I have to say I lived in Japan for 18 years and have no memory whatsoever of this holiday – it’s just one of those days when you don’t have to go to work for one reason or another. Japan has more public holidays than any other major country every year and for most of them people have no idea what the holiday they’re observing is.
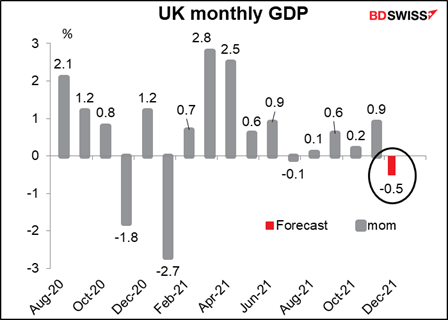
Then early in the European day it’s UK short-term indicator day, so-called because they announce several indicators that give an idea what the short-term direction of the economy is likely to be. These include industrial & manufacturing production, trade data, and the star of the show this month, Q4 GDP. The market is looking for 1.1% qoq, the same as in Q3. According to the Bank of England’s February Monetary Policy Report, GDP was up 1.1% in the three months to November but fell in December and January due to the pandemic. I therefore think 1.1% could be a bit optimistic.
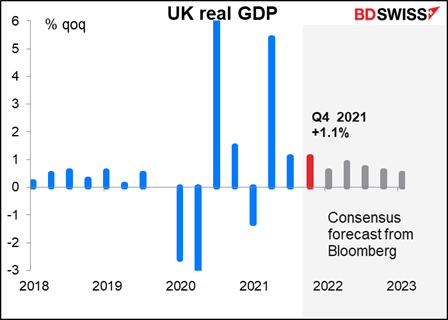
There will be a lot of interest in the monthly GDP figure for December alone to gauge the impact of Omicron and ‘Plan B’ restrictions on growth. The market looks for a contraction of 0.5% mom.
In any case the market seems to agree with the Bank that activity is likely to slow this year, “driven mainly by slower growth in demand,” as the Bank put it. That seems likely, given that the Bank is raising interest rates while inflation is expected to hit 7.25%. According to the Bank’s calculations, real post-tax labor income – perhaps the best measure of standards of living since it accounts for the rising tax burden as well as inflation and earnings – will fall by 2% in 2022. This is the biggest fall since records began in 1990.
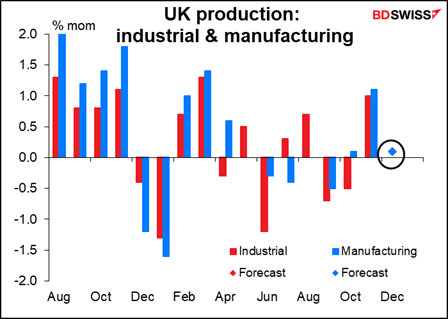
Industrial and manufacturing production are both expected to be up the same pitiful 0.1% mom, which explains why there’s only one dot visible in the graph.
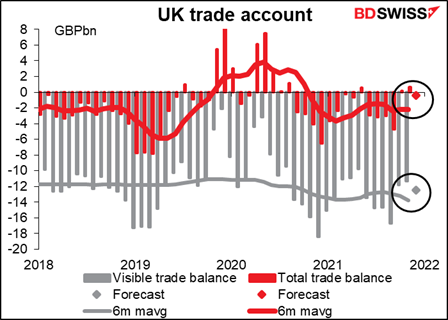
The UK visible trade deficit is expected to widen slightly, but the overall trade surplus (including services) is forecast to flip back into a small deficit.
The UK services surplus has been rising recently. I wonder how long that will persist though.
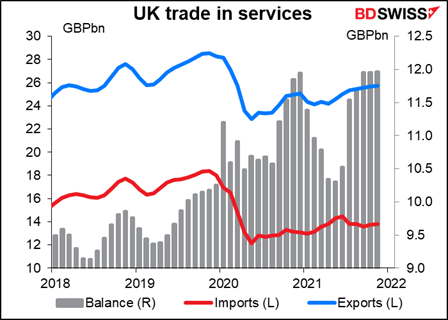
The improvement seems to be coming mostly from three areas: 1) the deficit on travel has disappeared as no one can go abroad (this seems to be a function of the virus rather than Brexit) and 2) the surpluses on “telecoms, computers, and information” and “other business services” have been growing. On the other hand, the contribution of “financial services,” historically the largest contributor to the services surplus, has been shrinking and is now overtaken by “other business services,” whatever that is.
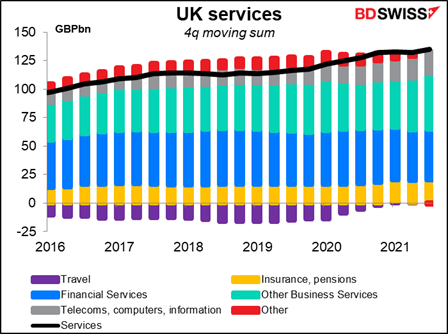
Trade is the Achilles heel of the pound. The country has a chronic trade deficit and so has to attract investment in order to keep the pound stable.
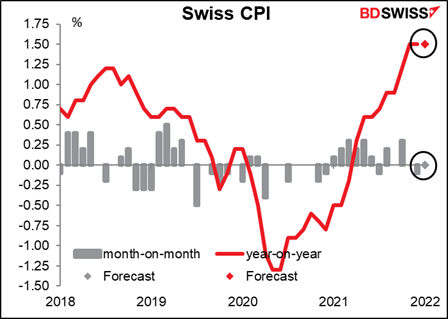
I’ve never paid much attention to Swiss economic indicators because with the Swiss National Bank (SNB) on hold since 2015 there wasn’t much point. But now that the markets are starting to price in a change in SNB policy I shall have to. Swiss consumer prices are expected to be unchanged from the previous month while the yoy rate of inflation is also expected to stay unchanged. It’s still below the SNB’s 2% target so nothing to worry about yet. This may confirm in the Bank’s mind that they’re right not to intervene and to let CHF appreciate to avoid importing inflation and so could be mildly positive for CHF.
Source: BDSwiss