Rates as of 05:00 GMT
Market Recap
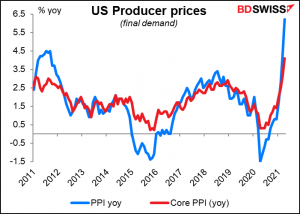
While fear of inflation has been driving markets recently, things went into reverse yesterday despite yet another surprisingly strong inflation figure, this time for the US producer price index ( 6.2% yoy vs 5.8% estimate).
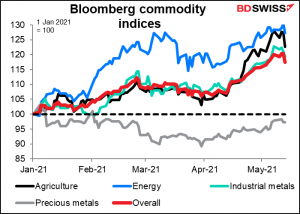
In particular, commodity prices dropped sharply.
Of course, this is in the context of a steady rally in almost all classes of commodities this year. One day doesn’t mean the end of a rally.
It’s hard to say exactly what caused the sudden turnaround in commodities. Some reports blame it on renewed fears about the virus, which hit oil prices particular asp problems arise in key oil-importing countries. Japan said it would expand its state of emergency to more areas, raising risks for the economy in Q2; China reported its first infections in about a month; and India is still reporting over 300k cases a day.
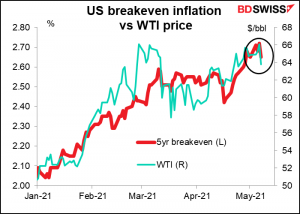
As commodity prices fell, breakeven inflation rates fell too, and bond markets rallied. That helped to propel stocks higher.
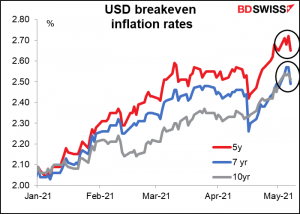
You can see how breakevens are following the oil price
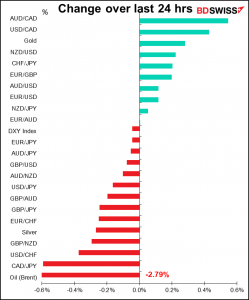
Of course, CAD was down along with oil. My favorite chart:
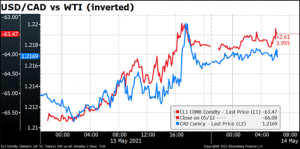
Plus, Wednesday’s rate advantage for CAD turned around.
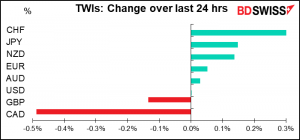
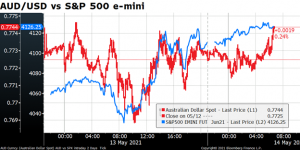
What surprised me though is that on this “risk-on” day, with the S&P 500 up 1.2% and NASDAQ 0.7%, the safe-haven CHF and JPY were the top performers. And even with commodities coming off, NZD and AUD were up a bit.
NZD and AUD are trading along with risk sentiment, not commodity prices.
For JPY, just as the rise in US bond yields Wednesday sparked thoughts of an outflow from Japan, the decline in US bond yields Thursday calmed those fears and JPY came back.
I can’t believe that this long-running trend is over in one day. I’d look for some mean reversion. Whether that comes on Friday or starts Monday is another question. My feeling is Monday. Today we’re more likely to see people taking profits ahead of the weekend and closing out positions. Over the weekend though they’ll read a lot of articles about inflation-this and inflation-that and start all over again on Monday.
Today’s market
Note: The table above is updated before publication with the latest consensus forecasts. However, the text & charts are prepared ahead of time. Therefore, there can be discrepancies between the forecasts given in the table above and in the text & charts.
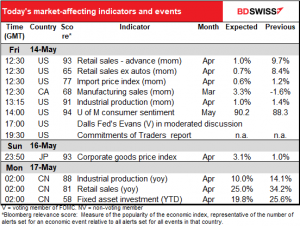
Several big US indicators out today.
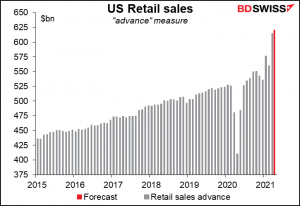
US retail sales are an important indicator for the consumer-driven US economy. Even after March’s 9.7% mom surge, powered by the $1,400/person stimulus checks, retail sales are expected to rise further – presumably because people weren’t able to spend all of it in March, or some people didn’t get their checks on time. I think another indication of strong demand would tend to confirm the narrative that the US economy is roaring back, perhaps pushing stocks higher and the dollar lower.
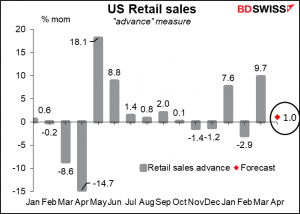
If the forecast is correct, retail sales will be 17.9% higher than their pre-pandemic level. That’s astonishing! Before this, it took five years – from June 2015 to Feb. 2020– for retail sales to grow that much.
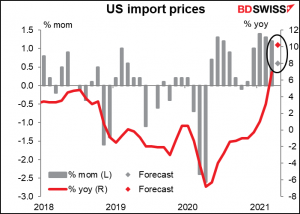
I don’t usually pay much attention to US import prices, but nowadays anything connected to inflation is likely to set alarm bells ringing. The forecast 10.4% yoy rise would be the highest since Sep. 2011. This indicator though does often go very, very high, probably because of oil prices; the peak was 21.4% yoy in July 2008.
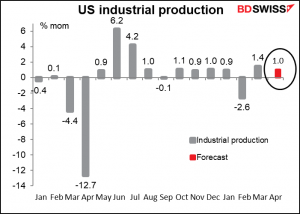
In contrast with booming retail sales, US industrial production on the other hand is recovering steadily but not dramatically. The difference between the two is one reason why the US has a record trade deficit now.
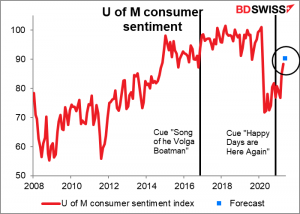
US consumer confidence is expected to continue climbing, now that the Rebel Alliance has vanquished the Galactic Empire and Jabba the Hutt is no longer in power. A record S&P 500 and continually improving job market also help.
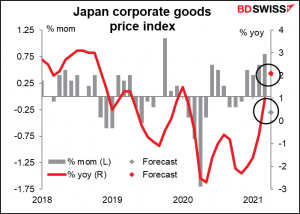
Then early Monday, Japan releases its corporate goods price index, better known elsewhere as the producer price index. I just present it here because everyone is on edge about anything having to do with inflation, but frankly I don’t think Japan will contribute much to this “global inflation” narrative. On the contrary, Japan is an outlier when it comes to inflation. The yoy change in the national CPI is expected to fall when it’s released next week. Can you believe it? Anyway, the corporate goods price index is expected to show a pretty sharp rise from 1.0% yoy to 2.1% yoy, but I don’t think it will matter for the national CPI.
Then later Monday we get the Chinese triumvirate of retail sales, industrial production, and fixed-asset investment. Only yoy rates of change are available and since China was tanking last April, I’m not sure how much value there is in the data. I do know that there’s no value in a graph.
Source: BDSwiss