Note: The table above is updated before publication with the latest consensus forecasts. However, the text & charts are prepared ahead of time. Therefore there can be discrepancies between the forecasts given in the table above and in the text & charts.
Rates as of 05:00 GMT
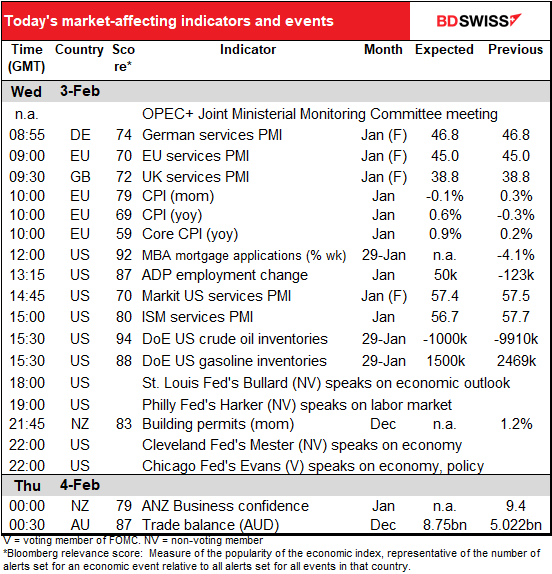
Market Recap
Stock markets resumed their rise as the markets noticed the Democrats’ continued commitment to a larger fiscal package, progress on the vaccine front, and favorable earnings headlines.
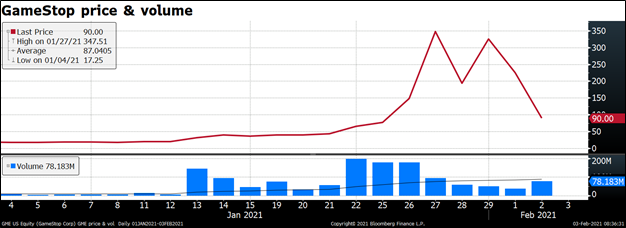
The rally proceeded without many of the favorite stocks of the retail traders who follow the scuttlebutt on wallstreetbets. The S&P 500 was up 1.4% and the NASDAQ 1.6%, but GameStop fell 60% to $90 from $225 (following a 31% fall Monday), while AMC Entertainment fell 41%.
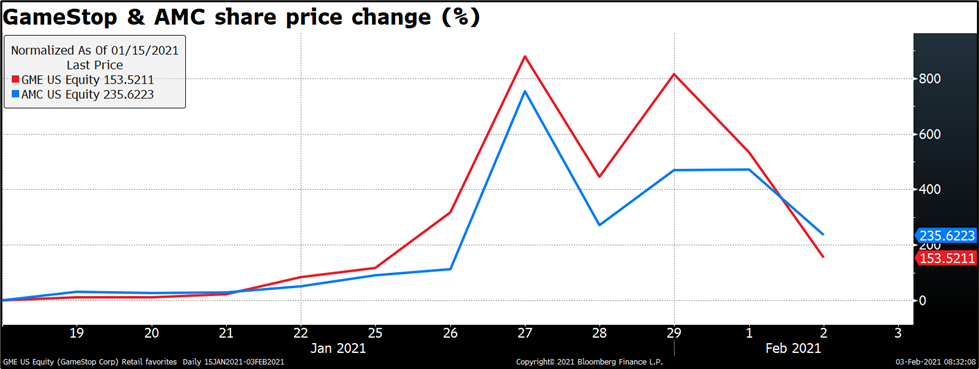
Admittedly people who bought GameStop on the first day of the year at $17.25 were still sitting on a nice profit, but how many people did? Much of the volume was done on the 25th @ $77, 26th @ $148 and 27th @ the peak (close) of $348. (The intraday peak was on the 28th at $483.)
While much of this activity has been attributed to the retail world, some market participants say that in fact hedge funds have been front-running the retail traders. A Bloomberg article claimed that funds have been using computers to follow the chatter on these discussion boards and trade on it. Given that these funds operate at the nanosecond pace while many retail traders are buying the wrong GME (there’s a stock with a similar ticker listed in Australia that saw its stock price nearly double on Jan. 29th due to mistaken purchases), it’s not obvious who’s made money here and who’s lost money.
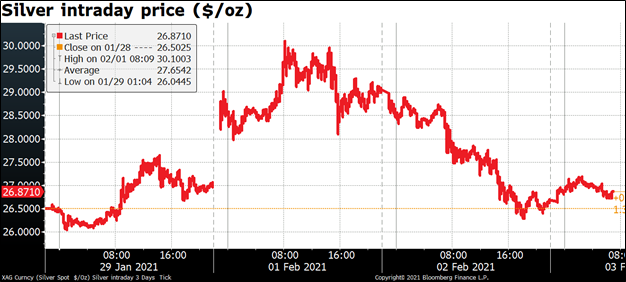
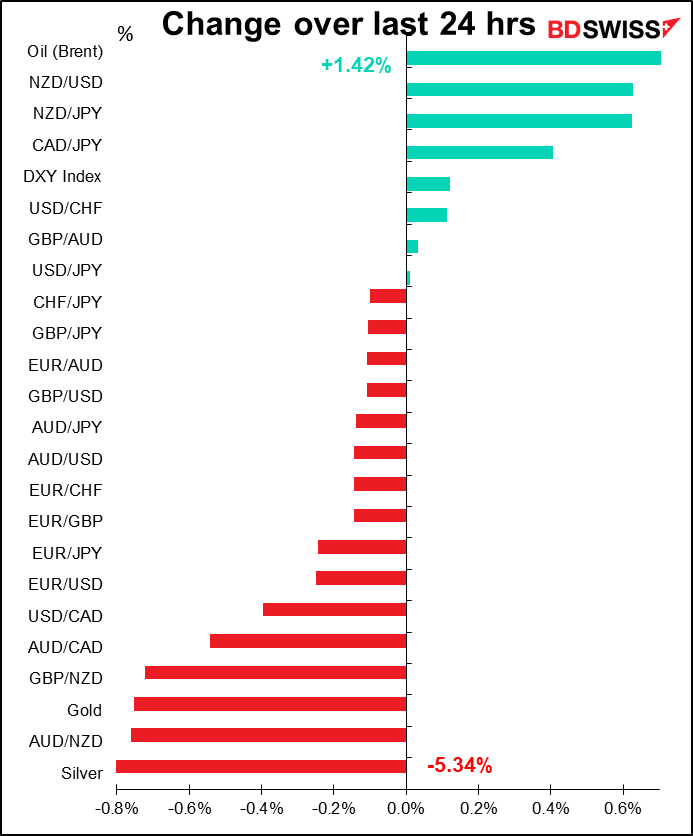
Silver, which gapped higher at the opening Sunday on speculation that it would be the latest target of buying by the retail crowd, fell steadily yesterday, although it stabilized somewhat in late US trading.
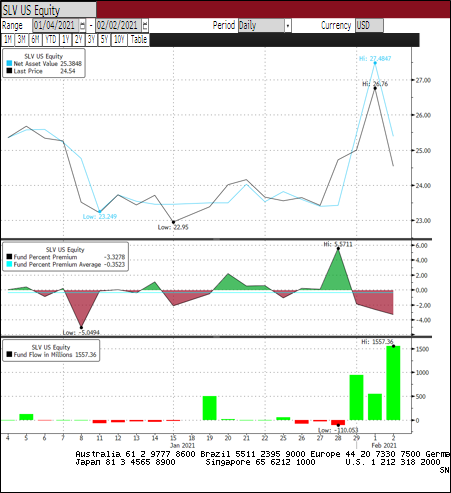
One of the noticeable things about the run-up in silver is the unusually large spread between the price for physical silver and “paper” silver, such as silver in the form of exchange-traded funds. This can be seen in the gap between the net asset value of the iShares Silver Trust (blue line), the largest silver ETF, and its price (white line). The discount (red filled-in area in the second section) shows this discount (-3.33%). Over the last year, this ETF has on average traded at a premium of 0.13%. The premium for physical metal is a sign that people are buying to hedge against disaster, not buying for investment purposes.
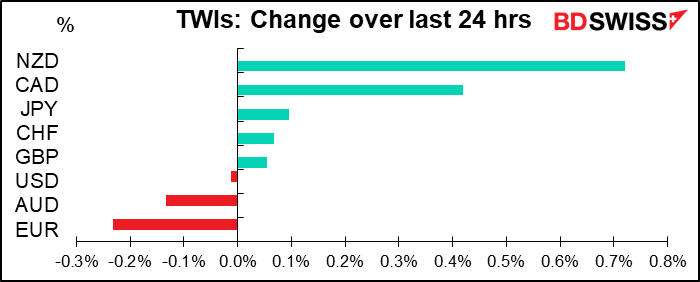
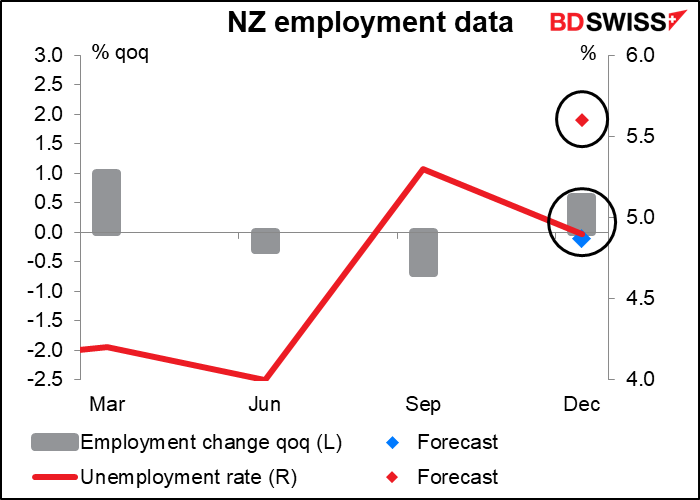
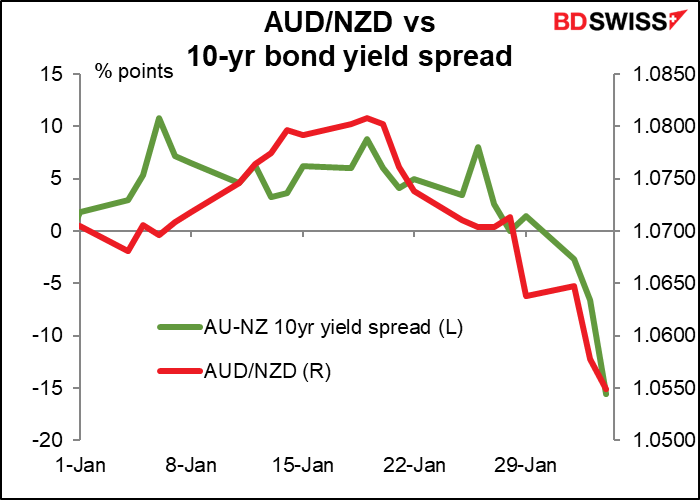
Getting back to currencies, NZD was the top performer after New Zealand unemployment beat expectations. The unemployment rate fell to 4.9% vs a rise to 5.6% expected (previous 5.3%), while the number of employed rose by 0.7% yoy instead of falling by 0.1% as expected. It was particularly significant that the unemployment rate fell even though the participation rate rose to 70.2% from 70.1%.
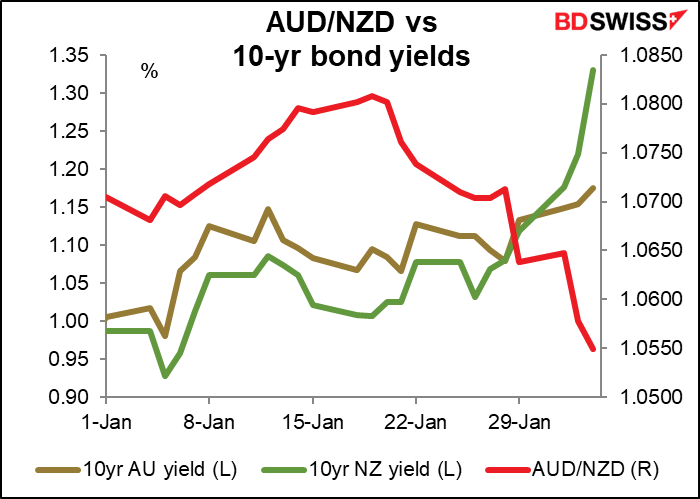
The better-than-expected data pushed New Zealand bond yields up further. Recently NZD bond yields have been rising faster than AUD bond yields, which has been depressing AUD/NZD (i.e. NZD gaining on AUD).
CAD ignored oil prices on Monday, but Tuesday the currency followed the rally as oil rebounded to a post-pandemic high.
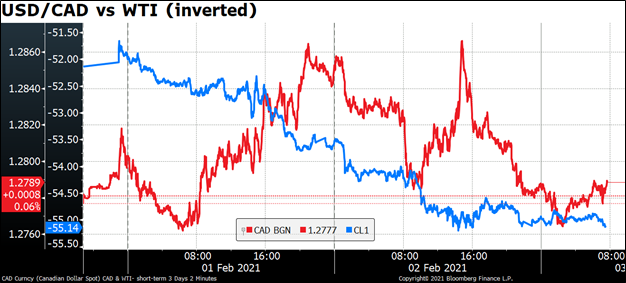
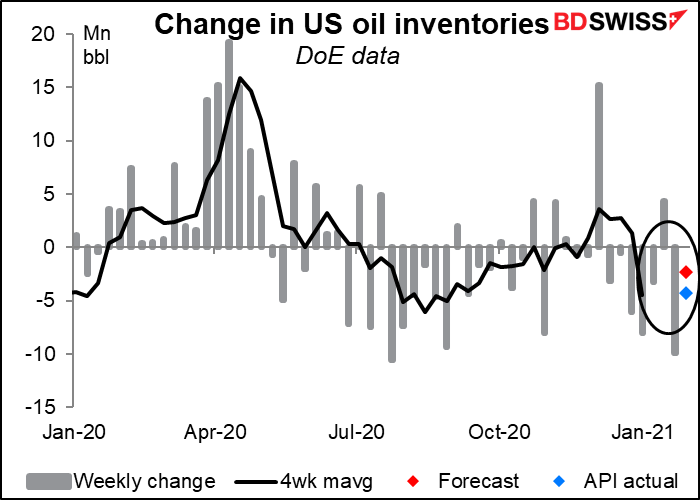
Oil prices rose after the American Petroleum Institute (API) announced a larger-than-expected 4.3mn barrel drawdown in oil inventories during the latest week. The market was looking for the US Dept of Energy to announce a 2.3mn bbl drawdown later today. Chinese oil inventories are also said to be the lowest in almost a year. With OPEC expected to keep its output steady (see below) the supply/demand picture for oil appears to be improving. That should be bullish for CAD.
Italian politics took an interesting turn as Italy’s President Mattarella is expected to ask former European Central Bank (ECB) Chair Mario Draghi to form a new government of national unity. Draghi is one of the most highly respected officials in Europe, not to mention a favorite of the financial markets, and so his appointment could be a modest EUR-positive factor. However as one Italian politician noted, if the parties that had previously formed a coalition could no longer agree to work together, it’s not certain that another combination of parties could be found that could work together any better. He may do “whatever it takes” to form a new government, but it might take another election.
Today’s market
The OPEC Joint Ministerial Marketing Committee meets today. This is a technical group that meets every month to assess the market and make recommendations to the larger group, which will meet again in early March to decide on the next steps. OPEC was scheduled to increase output in January by 500k barrels a day (b/d), of which OPEC’s share was 300k b/d, but in the event the 13 members of OPEC boosted output by only 190k barrels a day (b/d), thanks to supply disruptions in Nigeria and Libya.
After the increase in January, the group resolved to keep output steady for two months to see how matters developed. Press reports say the committee isn’t expected to recommend any adjustments to the group’s agreement.
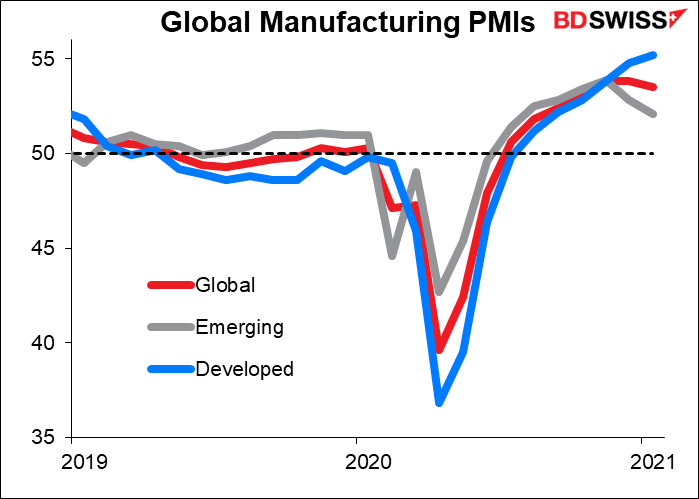
As for the indicators, Monday we got the final manufacturing purchasing managers’ indices (PMIs) – today we get the final service-sector PMIs.
The manufacturing PMIs were notable in that the global manufacturing PMI declined for the first time since the recovery began last May. Developed economies’ manufacturing PMI continued to rise but the emerging market index fell, led by China. Nonetheless a small majority of countries showed a net increase in their PMI for both the latest month and compared to three months ago. Furthermore, all countries besides Myanmar, Greece and Thailand have a higher PMI than they did a year ago, before the pandemic hit.
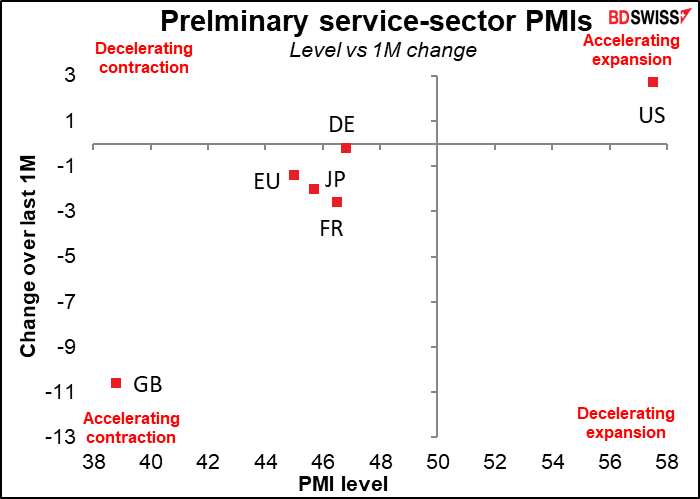
However the service-sector PMIs are more important than the manufacturing PMIs, because the service sector is where the pandemic is really hitting, and the signs there are not good. Most of the preliminary PMIs were in the “accelerating contraction” quadrant, with the UK the standout fiasco. Only the US was in “accelerating expansion.”
We’ll have to see how the other countries do. Signs are that progress has been stagnating recently.
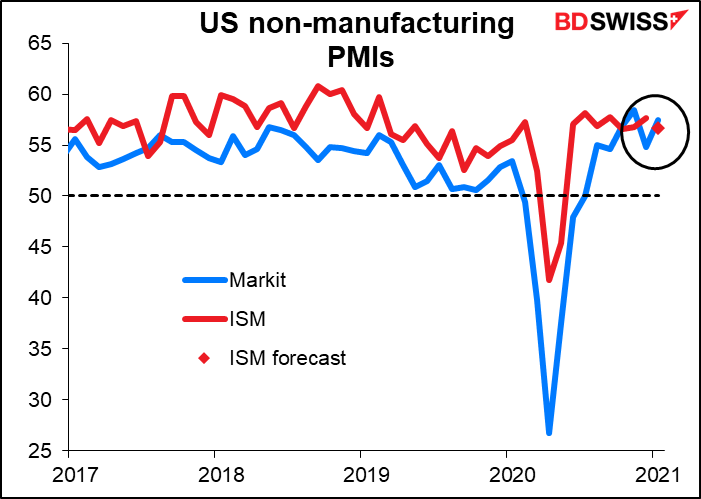
The US Institute of Supply Management (ISM) version of the service-sector PMI is expected to decline by 1.0 point, in contrast to the Markit version, which rose by 2.7 points during the month. Heaven only knows why. In any event they’re expected to be almost the same (56.7 for the ISM vs 57.5 for the preliminary Markit version) so I’m not sure it matters – either way they’re still strongly in expansionary territory.
Today’s EU consumer price index (CPI) will be calculated using the new weights for 2021.
As I discussed last week when the German CPI came out, the consumer price index (CPI) is calculated by taking the price of a representative basket of goods and services that the average consumer buys. Every year the statisticians rebalance this basket to take into account changes in what people have bought during the preceding year. Normally these adjustments are small and slip by without any notice, but not this year. This year, everyone’s consumption patterns changed radically. Restaurant meals? Forget it! Homecooked food – lots of it. Air travel? Not much. New bicycle? Millions! The weights in the EU’s January CPI, released today, will reflect these unusual consumption patterns.
Eurostat, the European statistical agency, has given some guidance about what the changes might be, but it’s still unclear. Food will have a higher weight, while services and energy should be lower. That suggests headline inflation, which includes fresh food and energy, is likely to be higher than it is now relative to core inflation, also more volatile as fresh food prices will have a bigger weight. We won’t know the details until the final CPI is published on Feb. 18th.
The changes are likely to have a different effect at different points during the year. For example, in the summer the price of travel and package tours is usually a major component of the CPI, but not this year. That means the inflation figure for July and August may be lower than it would otherwise have been, and November higher (since few people usually take a holiday in November even in a normal year).
Although it’s worth knowing about this change, it’s not something to worry about that much. The difference is liable to be in the neighborhood of 10 bps or so, not a major change. Furthermore, the European Central Bank (ECB) is well aware of the changes and any change attributable to the new weightings would probably not affect their assessment of the euro area’s inflation dynamics.
Although mom prices are expected to fall slightly, on a yoy basis they’re expected to accelerate a lot. In part that’s due to a base effect — last year in January prices fell by 1.0% mom. But there are also independent reasons why prices will only be down 0.1% mom in January (or may even rise on a mom basis, judging from the flash estimates from other countries so far).
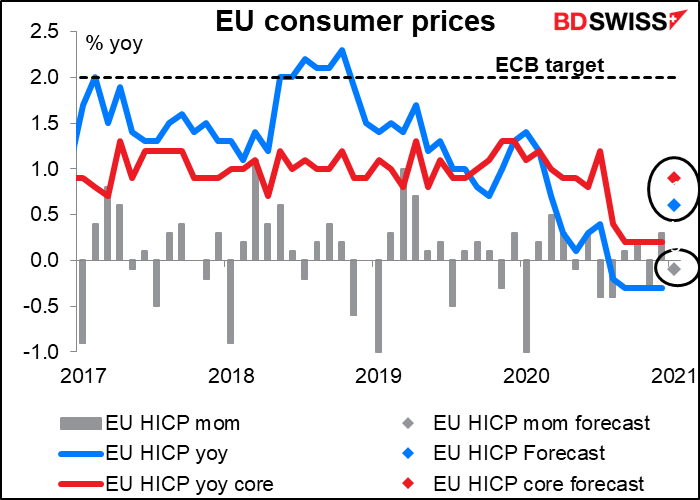
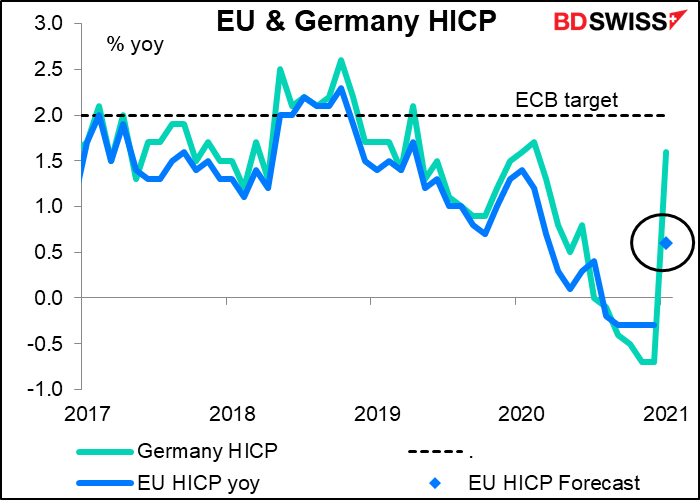
For example, German’s CPI jumped ( 1.4% mom vs 0.3% expected) due in part higher energy prices but also the end of the temporary German VAT cut and the introduction of carbon pricing. French CPI also beat expectations ( 0.3% mom vs 0.0% expected) as did Spain (-0.3% mom vs -1.4% expected). There were some individual factors, such as a delay in the annual clothing sales in France, but overall it looks like food and energy prices have been higher than expected, perhaps reflecting new weights for those categories as well.
The figures are likely to complicate work for the European Central Bank (ECB), because although it looks like inflation is accelerating, much of the rise is just a statistical optical illusion caused by the reweighting and pandemic-induced distortions. The underlying price pressures remain weak. The ECB may have trouble communicating why it has to keep worrying about too-low inflation when inflation appears to be accelerating.
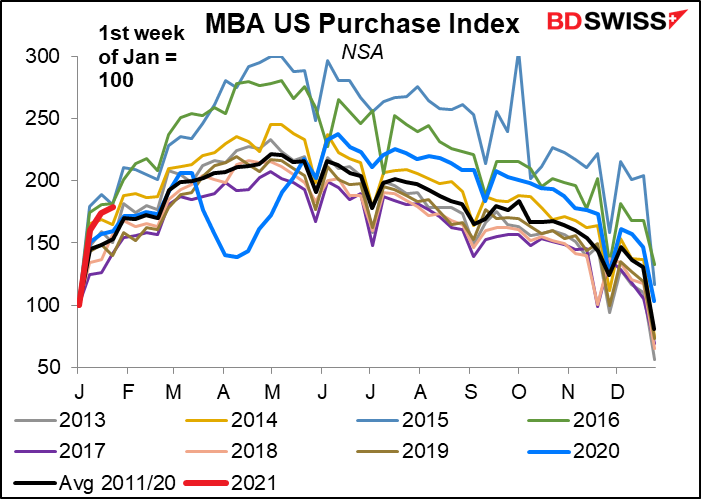
There’s no forecast for the Mortgage Bankers’ Association (MBA) mortgage applications index. So far it’s been coming in at the top end of the historical range, indicating that last year’s housing boom continues.
The big event of the day is the ADP employment report. Automated Data Processing Inc. (ADP) is an outsourcing company that handles about one-fifth of the private payrolls in the US, so its client base is a sizeable sample of the US labor market as a whole. It’s therefore watched closely to get an idea of what Friday’s US nonfarm payrolls (NFP) figure might be. One point to note: the ADP adjusts its figures to match the final estimate of NFP, not the initial estimate that we get this Friday. So while it’s one of the best guides to the NFP that we have, it’s not perfect by any means – in fact, neither is the NFP figure itself, since it’s always revised.
The 50k forecast for today’s ADP report compares with a 70k forecast for the NFP. I don’t know whether that’s because people genuinely think the two will be different or because of a different group of forecasters.
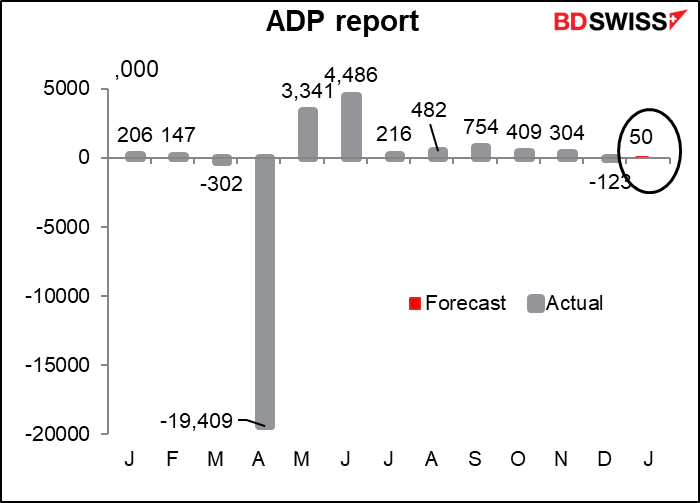
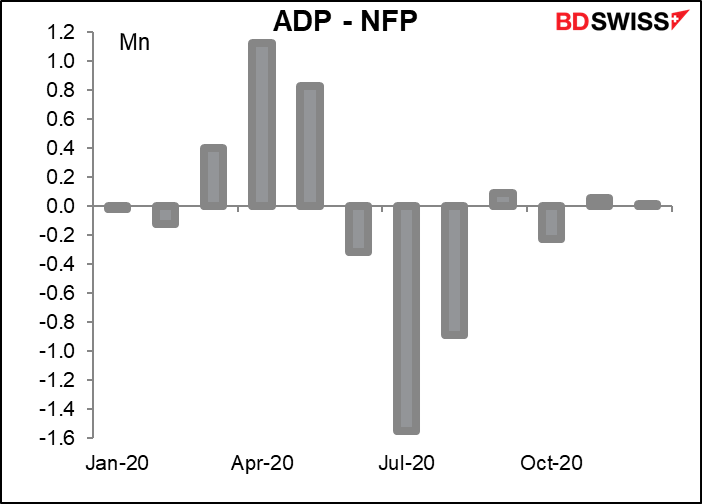
In any case, the ADP hasn’t been too bad a forecaster of the NFP recently. Last month it was only off by 17mn.
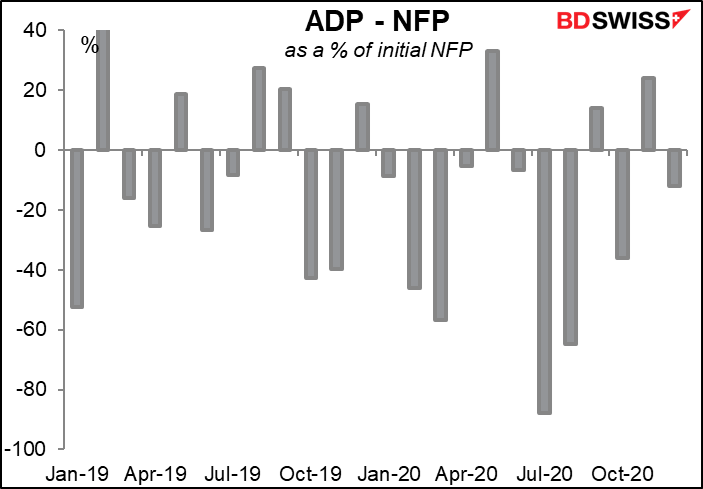
If we look at it as a percent of the NFP, it’s a fairly small error by historical comparison.
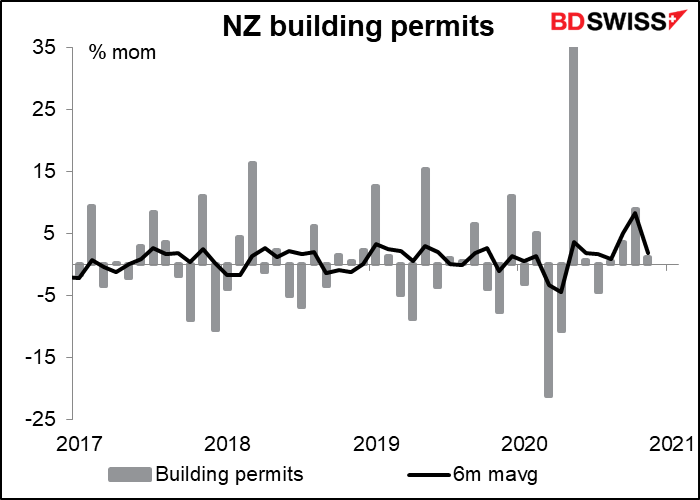
There’s no forecast for New Zealand building permits and I couldn’t detect any noticeable impact that it has on the currency, but the Bloomberg score is high so I’m presenting a graph just in case someone is interested.
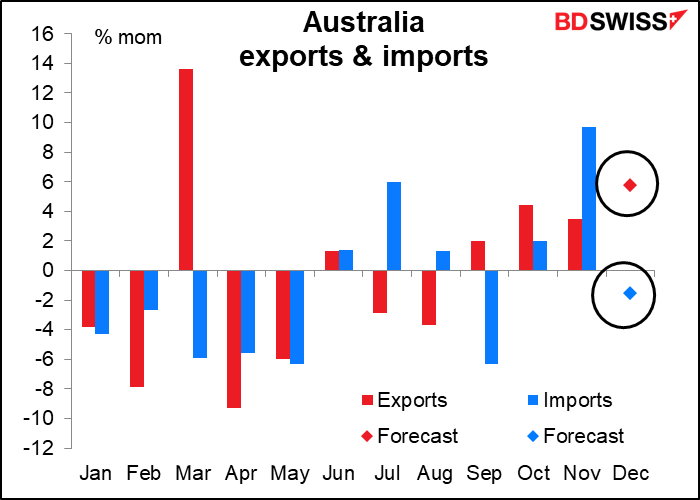
Australia’s trade surplus is expected to soar. The forecast level of AUD 8.6bn would be the second-highest on record, after 9.8bn in March.
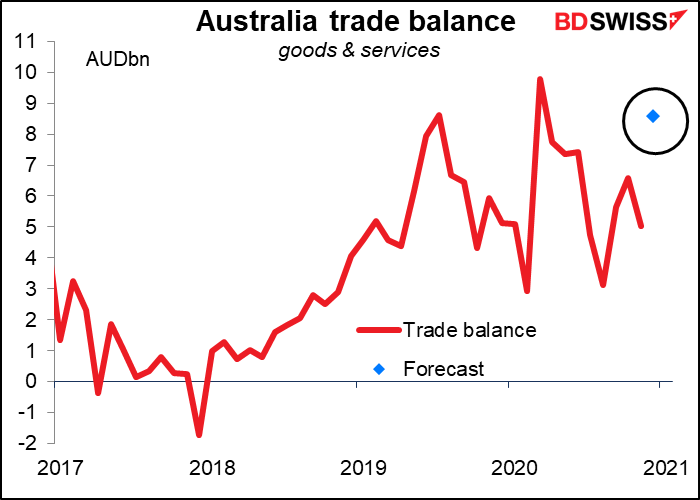
That’s because exports are expected to be up this month, while imports are expected to be down. Iron ore exports earnings are soaring as strong demand from China meets disrupted supply from Brazil. Meanwhile, exports of agricultural goods are recovering after the drought ended. On the other hand, the sporadic lockdowns are dampening domestic demand for imported goods.
Source: BDSwiss