Previous Trading Day’s Events (28.03.2024)
- According to the report yesterday Canada’s gross domestic product strongly rebounded in January exceeding expectations and February’s preliminary estimates point to another expansion, tempering pressure on the Bank of Canada (BoC) for an early rate cut.
The economy grew by 0.6% in January, its fastest growth rate in a year. February’s GDP is also likely to have grown by 0.4%.
The central bank has maintained its key policy rate at a 22-year high of 5% since July, but BoC’s Governing Council in March agreed that conditions for rate cuts should materialise this year if the economy evolves in line with its projections.
Canada’s economy has evaded recession in the face of high interest rates which the BoC has maintained at a 22-year high of 5% for the last eight months in efforts to rein in inflation.
Source: https://www.reuters.com/markets/canadas-gdp-outperforms-jan-growth-forecast-likely-grew-04-feb-2024-03-28/
______________________________________________________________________
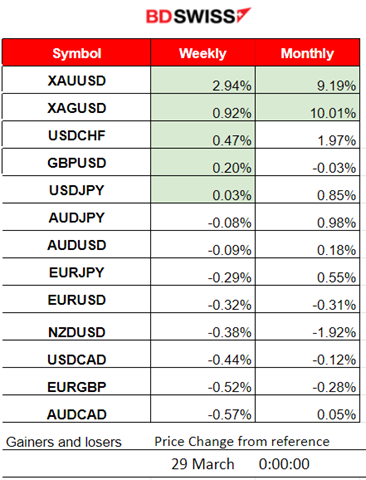
Winners vs Losers
XAUUSD is leading with 2.94% gains this week and 9.19% for the month. Silver follows with 0.92% gains this week but remains the top performer for this month with near 10% gains.
 ______________________________________________________________________
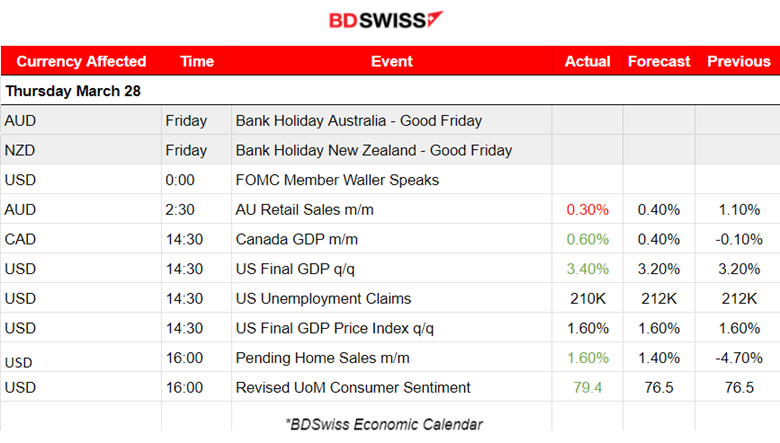
News Reports Monitor – Previous Trading Day (29 Mar 2024)
Server Time / Timezone EEST (UTC 02:00)
- Midnight – Night Session (Asian)
Monthly retail sales figures for Australia show 0.30% growth which is less than expected. No major impact was recorded in the market.
- Morning – Day Session (European and N. American Session)
In Canada, Real Gross Domestic Product (GDP) grew 0.6% in January. Goods-producing industries were up 0.2% in January 2024 with the utilities and manufacturing sectors rebounding from declines in the previous month. The CAD appreciated greatly after that. USDCAD saw a dive after the news near 67 pips. At the same time, the U.S. Final GDP figure for the quarter saw a better-than-expected growth at 3.40%, in the fourth quarter of 2023.
General Verdict:
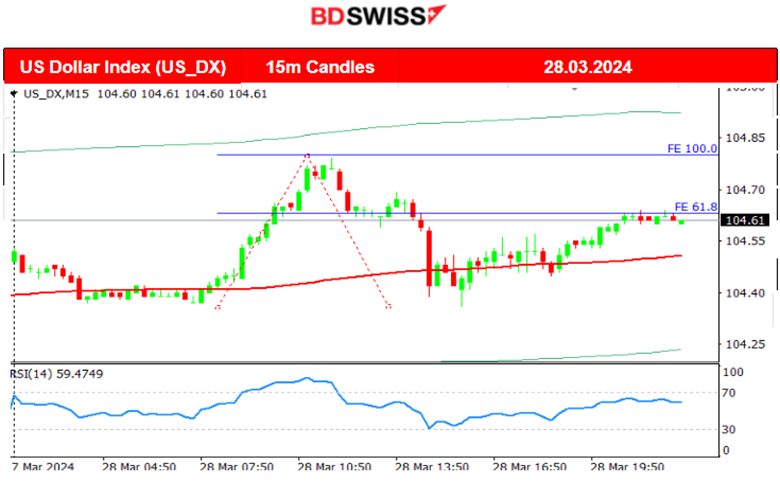
- FX volatility was quite high yesterday. The dollar was affected greatly but did not move significantly in one direction overall.
- Gold moved greatly to the upside.
- Crude oil is to the upside as well with similar steady movement.
- Sideways movement for the U.S. indices and low volatility.
 __________________________________________________________________
FOREX MARKETS MONITOR
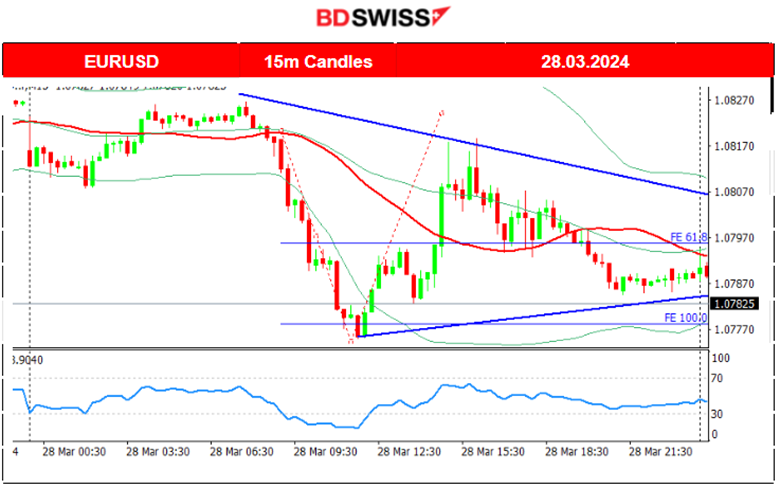
EURUSD (28.03.2024) 15m Chart Summary
Server Time / Timezone EEST (UTC 02:00)
Price Movement
The pair’s path was obviously driven by the USD. It saw an early drop near 45 pips as the USD strengthened suddenly and then retraced to the 30-period MA when the USD weakened. This is clearly visible in the DXY chart above. After the news at 14:30, the USD saw a strengthening since the figures released were positive for the USD.
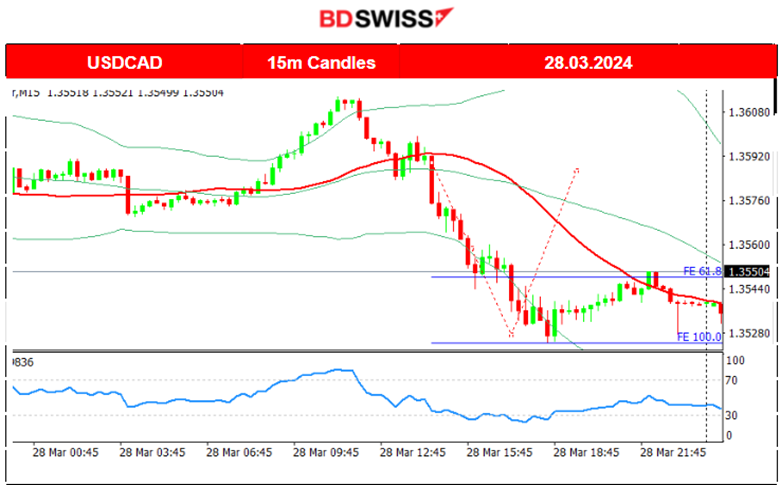
 USDCAD (28.03.2024) 15m Chart Summary
Server Time / Timezone EEST (UTC 02:00)
Price Movement
The pair saw an early movement to the upside, obviously from USD appreciation. Then after the European market opening the USD suffered with depreciation and the pair saw a dive. However, the CAD news came out in the currency’s favour and the pair dropped further until the support at 1.35280 before it saw a retracement to the 30-period MA.
 ___________________________________________________________________
CRYPTO MARKETS MONITOR
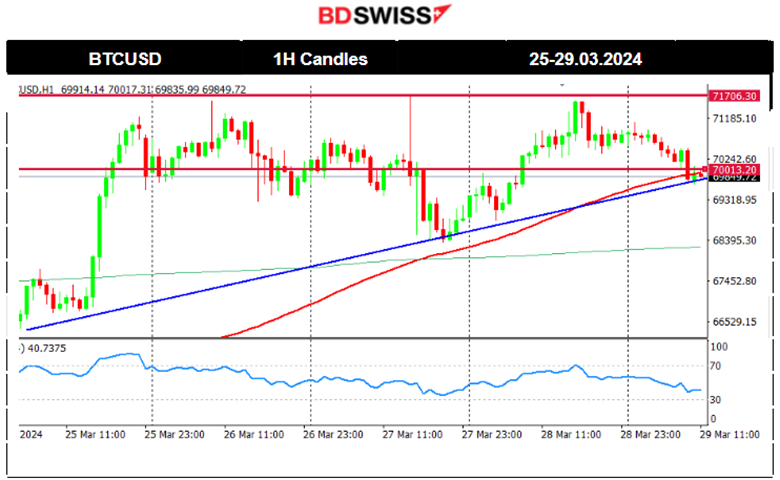
BTCUSD (Bitcoin) Chart Summary 1H
Server Time / Timezone EEST (UTC 02:00)
Price Movement
Bitcoin suffered losses recently dropping from the peak at 74K, and continuing downwards until the FOMC event. After the news and during the press conference, Bitcoin saw a rise, returning back to the mean.
The 10 US spot bitcoin ETFs collectively saw net outflows each day last week and those net outflows slowed later in the week.
Since the 22nd of March, it actually experienced a good comeback with the price moving upwards crossing the 30-period MA on its way up and showing upward momentum. The 68K USD level resistance was breached on the 25th of March and the price moved higher even beyond 70K USD. The 30-period MA turned sideways as the price slowed down, remaining near 71K USD.
 Crypto sorted by Highest Market Cap:
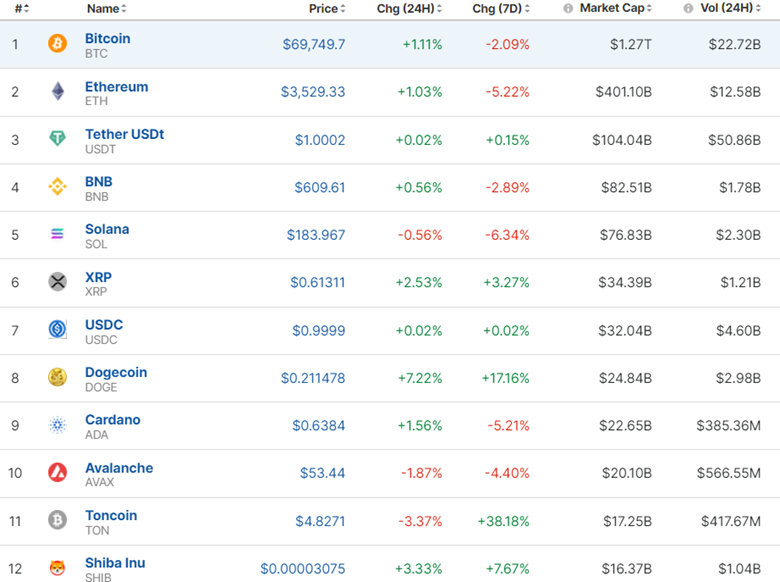
The market is in consolidation. Not much happening at the moment, The Good Friday Holiday is currently in place.
Source: https://www.investing.com/crypto/currencies
______________________________________________________________________
EQUITY MARKETS MONITOR
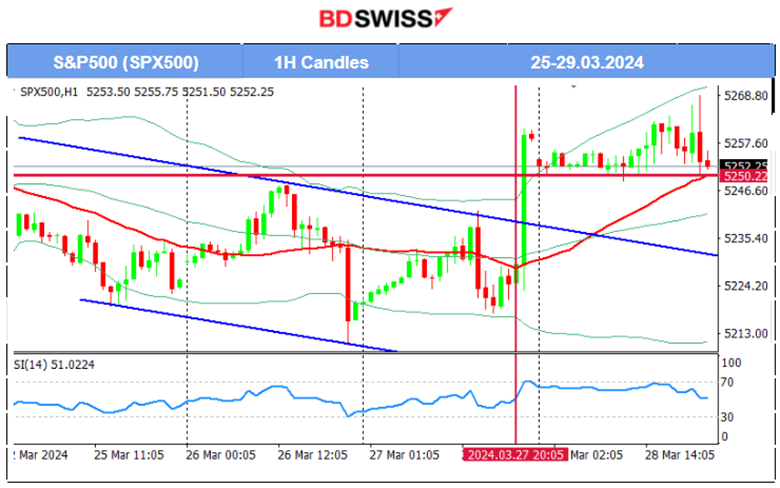
S&P500 (SPX500) 4-Day Chart Summary
Server Time / Timezone EEST (UTC 02:00)
Price Movement
S&P500 jumped to near 5270 USD on the 27th of March. This move broke the channel and it crossed the 30-period MA on its way up. 5,250 USD currently serves as a support now and its breakout might be the key to unlock a sharp drop.
 ______________________________________________________________________
COMMODITIES MARKETS MONITOR
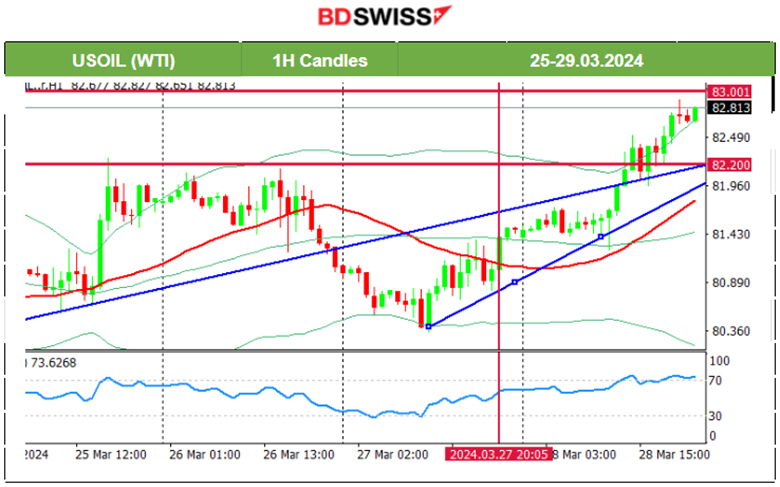
USOIL (WTI) 4-Day Chart Summary
Server Time / Timezone EEST (UTC 02:00)
Price Movement
On the 25th of March, Crude oil moved to 82.3 USD/b before retracement followed. After some consolidation period, the price moved to the downside rapidly with a reversal from the upside. This rapid downward movement boosted the probability of a retracement taking place on the 27th of March and it did as predicted in our previous analysis. The price reversed, crossing the 30-period MA on its way up and settled currently near 81.50 USD/b. On the 28th of March we have a wedge breakout to the upside that leads the price back to 83 USD/b. The 82 USD/b was an important resistance and upon breakout, it led to the price jump.
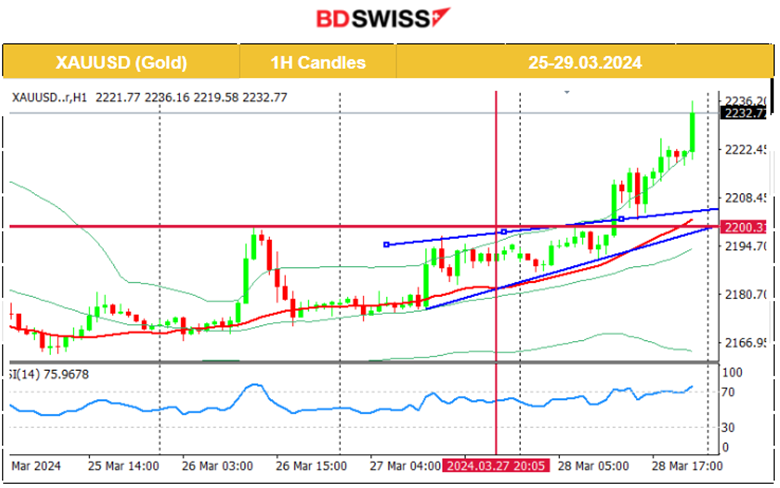
 XAUUSD (Gold) 4-Day Chart Summary
Server Time / Timezone EEST (UTC 02:00)
Price Movement
Since the 21st of March Gold moved below the 30-period MA and remained on a downtrend until the 25th of March where it settled near the mean at 2,170 USD/oz. As predicted in our previous analysis, the breakout of the triangle caused a jump in Gold’s price to 2,200 USD/oz on the 26th of March. The intraday reversal followed and Gold settled eventually at near 2180 USD/oz. On the 27th of March Gold saw a rise again and tested the resistance at 2,200 USD/oz again. As mentioned in our previous analysis, Gold continued with the upside on the 28th of March. It experienced a great upward movement as it broke that resistance. The 2,200 USD/oz level was quite important and part of a triangle formation. Its resistance breakout led to a jump over 2,230 USD/oz.
 ______________________________________________________________
News Reports Monitor – Today Trading Day (29 Mar 2024)
Server Time / Timezone EEST (UTC 02:00)
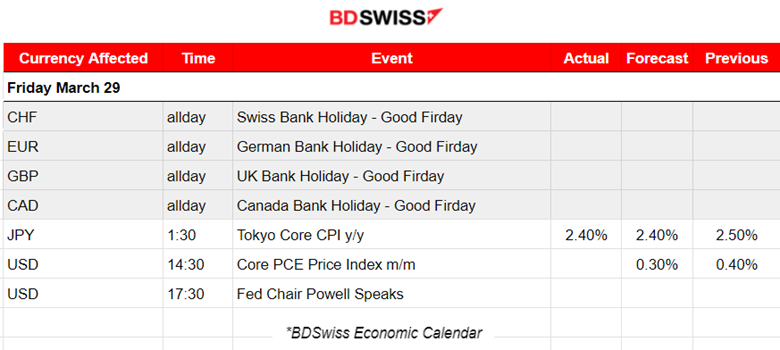
Good Friday today.
- Midnight – Night Session (Asian)
Core inflation in Japan’s capital slowed in March, heightening uncertainty on how soon the Bank of Japan can raise interest rates again after exiting its radical monetary stimulus. The core consumer price index (CPI) in Tokyo, an early indicator of nationwide figures, rose 2.4 % in March from a year earlier. JPY appreciated it at that time but the effect soon faded. USDJPY dropped near 30 pips momentarily and it reversed quite soon.
- Morning – Day Session (European and N. American Session)
The core PCE price index figure is expected to be reported lower month to month. We might have a surprise here with a higher-than-expected PCE figure. USD pairs are expected to be affected greatly and an intraday shock is possible. Fe’d Jerome Powell will speak at an event later that day at 17:30, participating in a moderated discussion with Kai Ryssdal at the Macroeconomics and Monetary Policy Conference, in San Francisco.
General Verdict:
- The FX market is volatile but it is expected to show more volatility later. We have the PCE price figure that is possibly going to shake the USD pairs at 14:30.
- Gold is closed today.
- Crude oil closed today.
- U.S. indices closed.
______________________________________________________________
Source: BDSwiss