PREVIOUS TRADING DAY EVENTS – 24 March 2023
Announcements:
- U.S. Secretary of the Treasury Janet L. Yellen called an FSOC (Council) Meeting after the banking-sector Turmoil. The Federal Reserve Bank of New York presented to the Council current market developments. The Council recognised the apparent stress in the economy but noted that the U.S. banking system remains sound and resilient. The regulators are obviously seeking to stabilise the markets and calm the depositors.
Source: https://home.treasury.gov/news - According to the latest U.S. PMI data for both Manufacturing and Services the U.S. companies show expansion in business activity in March with growing output as demand kicked in. The flash U.S. Composite PMI Output Index of S&P Global , which tracks the manufacturing and services sectors, increased to 53.3 this month. Good news also for the Eurozone since the latest flash PMI survey data indicate economic growth, signalling economic revival from the recent yearly downfall. There is positive sentiment for the U.K. as well, as the private sector growth was maintained according to PMIs March data, led by the service economy.Source: https://www.bloomberg.com/news/
Source: https://bdswiss.com/economic-calendar/ - US Crude Oil has been experiencing rising prices the previous week as a result of various factors, including the U.S. government’s promises to protect the bank depositors, U.S. announcements attempting to calm the markets and Russia’s announcement to proceed with oil production cuts at the end of June. However, high volatility continues to govern the market as we observed on Friday 24 March., U.S. Crude Oil price dives as banking crisis fears are still in play reaching as low as 66.9 USD (CFD price) and in the end reversing back, closing the day at 69.2 USD.
Source: https://www.bloomberg.com/news/
____________________________________________________________
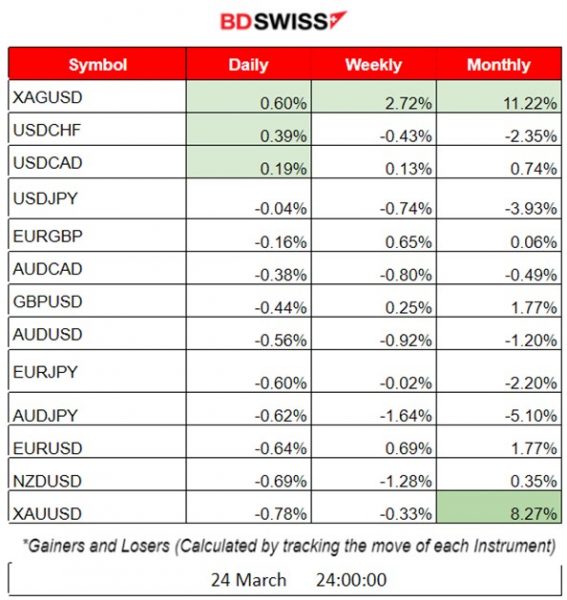
Summary Daily Moves –– Winners vs Losers 24 March 2023
- We observed no major overall changes on Friday for important FX pairs and Metals. The biggest change was with Silver (XAGUSD) of the size of 0.6%, followed by USDCHF with a minor change of 0.39%. Gold had a surprise fall with a negative change -0.78%.
- Last week’s winner was Silver, with an overall positive change in price of 2.72% followed by EURUSD having a change in price of 0.69%. AUDJPY price fell by 1.64%.
- So far this month, the winners are still Silver and Gold with price changes of 11.22% and 8.27% respectively, while the big loser being AUDJPY with a negative change, -5.10%.
______________________________________________________________________
News Reports Monitor – Previous Trading Day 24 March 2023
Server Time / Timezone EEST (UTC 03:00)
- Midnight – Night Session (Asian)
No important figures/release > No major impact.
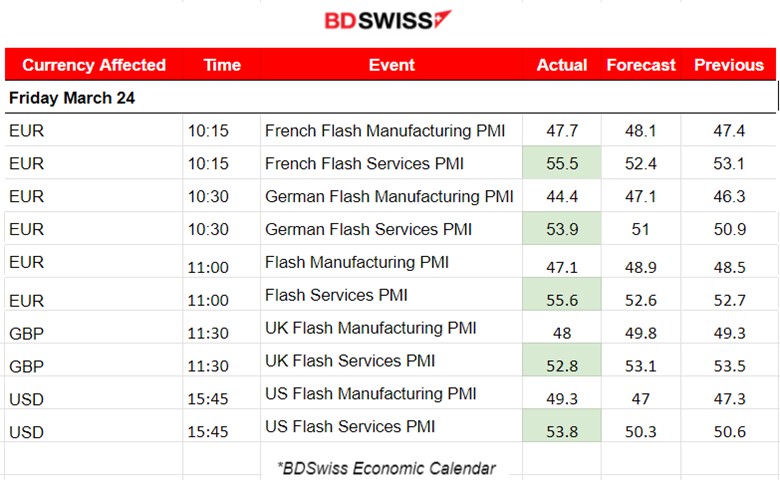
- Morning – Day Session (European)
The day was dedicated to PMI figure releases as far as the scheduled news is concerned. The PMIs indices are based on surveyed purchasing managers in the manufacturing and services industry. The index level above 50.0 indicates industry expansion while anything below it indicates contraction.
The figure releases for the Eurozone started at 10:15 and finished at 15:45 with the U.S.-related figures. The data show that there is growth in business activity for all economies. Services PMIs resulted in higher than expected and over 50.
The markets experienced volatility but no major trends were created since the charts show reversals and retracements at least on the major FX pairs concerning the USD, EUR and GBP.
General Verdict:
– No major shocks but high volatility even though it was Friday.
– Good news for the U.S., Eurozone and the U.K. according to the March PMI figures.
______________________________________________________________________
FOREX MARKETS MONITOR
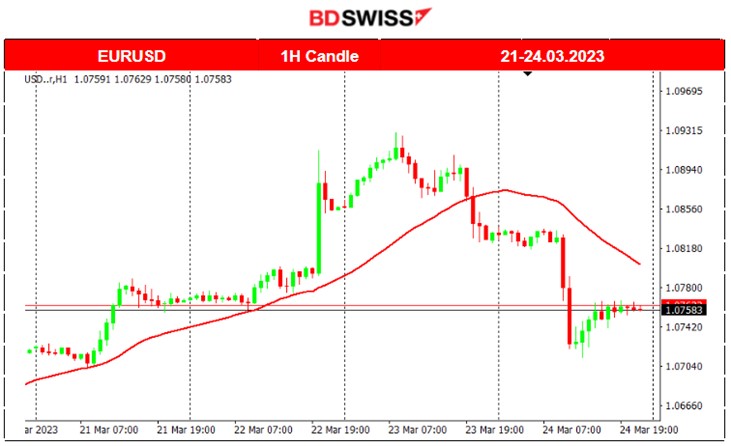
EURUSD 4-Day Chart Summary
Server Time / Timezone EEST (UTC 03:00)
Price Movement
The EURUSD was following an upward trend for the past few days but on the 23rd of March, it fell below the 30-period MA and continued a downward path signalling the end of the upward trend. After breaking significant intraday support levels, the pair moved further below following the positive PMI figures for the US, thus US dollar appreciation.
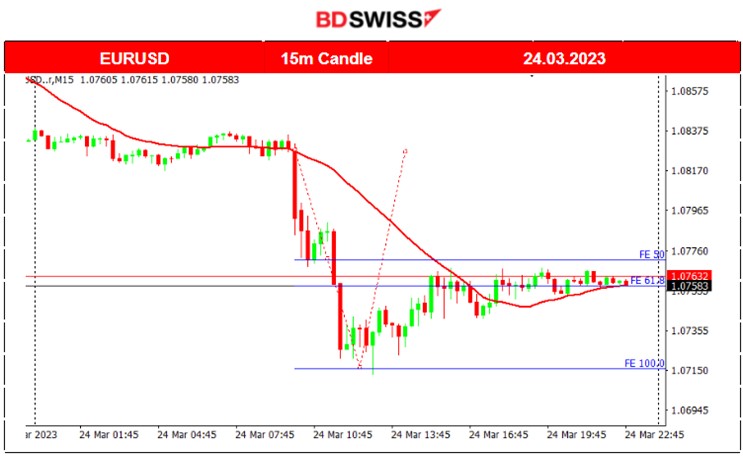
EURUSD 24.03.2023 Chart Summary
Server Time / Timezone EEST (UTC 03:00)
Price Movement
The pair was moving in range during the Asian session as the volatility was low. Then, the market started to show some volatility when it was approaching the European Markets’ opening. At that time, the pair moved rapidly downwards, below the 30-period MA as expected when the PMI releases for the Eurozone and later for the U.K. and the U.S. started to be released. Positive PMI figures for the U.S. brought the EURUSD further down but as expected these are not long-lasting shocks and the pair was bound to retrace.
Trading Opportunities
Fibonacci Expansion can help in identifying the retracement level of 61.8%. Since no lasting shock was expected, it would be good to look for the end of the downward move. The price was struggling to break the support levels at the 100% Fibo level so that would be the end. Traders are going long after that to catch the retracement until the 61.8% level.
______________________________________________________________________
______________________________________________________________________
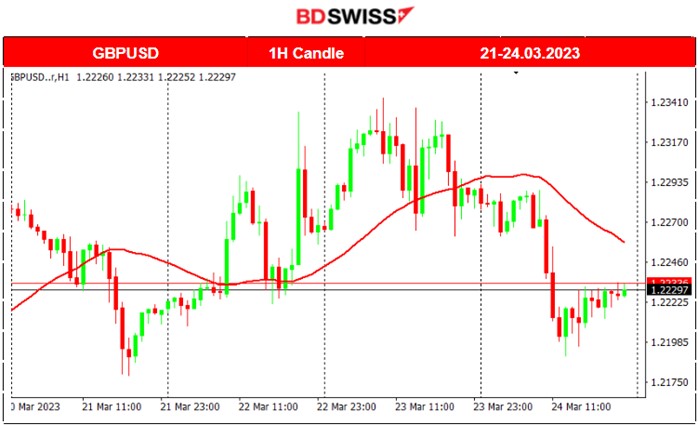
GBPUSD 4-Day Chart Summary
Server Time / Timezone EEST (UTC 03:00)
Price Movement
The GBPUSD pair has been moving around the 30-Period MA for the past few days with no clear medium-trend upwards or downwards. Since the 21st of March, high volatility was observed with maximum deviations from the MA being about 70-90 pips. Price reversal happened on the 21st with the pair crossing above the 30-period MA and another one on the 24th with the price crossing below the MA.
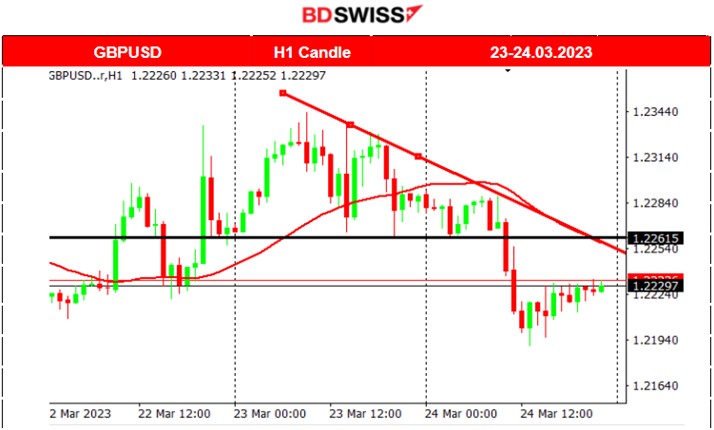
GBPUSD 24.03.2023 Chart Summary
Server Time / Timezone EEST (UTC 03:00)
Price Movement
GBPUSD pair experienced the same path as the EURUSD during the 24th of March since the USD was mainly driving the market. During the European session, the price started to fall rapidly and during the North America Session, it started to retrace.
Trading Opportunities
Our view on this pair was that the volatility on the 24th was expected, thus, the market should break support or resistance levels and deviate significantly from the MA. A triangle was identified with a significant support level of 1.2260. The market eventually broke that level and going short after that would be correct until the level of 1.220 at least,even though the market moved eventually further than that.
Our Technical Analysis here: https://www.tradingview.com/chart/GBPUSD/2YOLefhN-GBPUSD-Breakout-Downwards-24-03-2023/
______________________________________________________________________
EQUITY MARKETS MONITOR
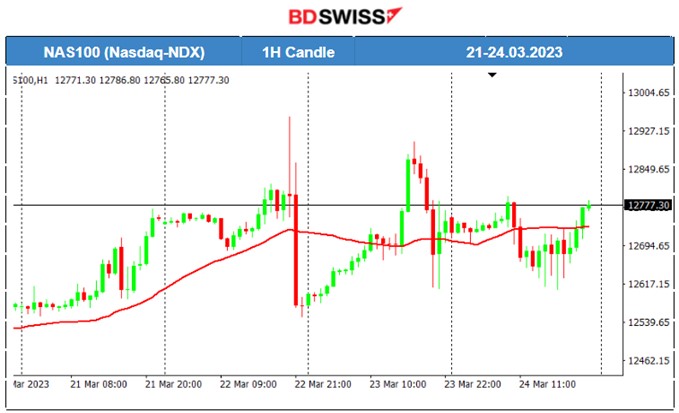
NAS100 (NASDAQ – NDX) 4-Day Chart Summary
Server Time / Timezone EEST (UTC 03:00)
Price Movement
The Nasdaq-100 is a stock market index of 101 equity securities issued by 100 of the largest non-financial companies listed on the Nasdaq stock exchange. The stock market has experienced high volatility in general, with indices prices moving sideways and around the 30-period MA, with overall results for prices ending up higher for the week. The main indexes eventually climbed when major rate-sensitive technology and growth stocks advanced, after news started to spread that the Federal Reserve might pause the interest rate hikes.
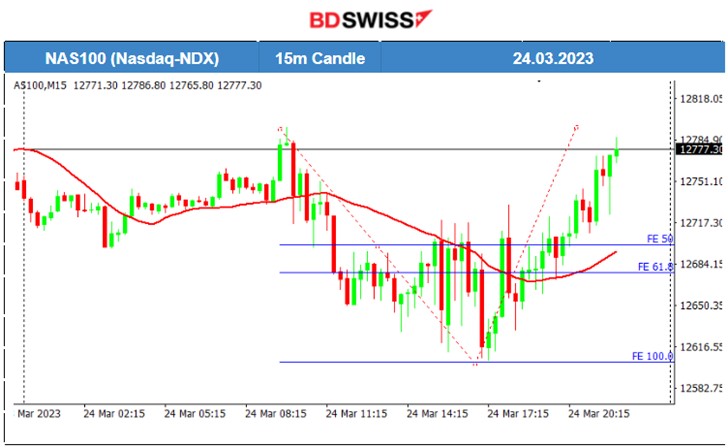
NAS100 (NASDAQ – NDX) 24.03.2023 Chart Summary
Server Time / Timezone EEST (UTC 03:00)
Price Movement
On Friday 24th, the price of the index was moving within a range but over the 30-period MA. During the (European) morning session, the price reversed and crossed the MA moving downwards. After the New York Stock Exchange opening, the index followed a volatile path and upwards experiencing a price reversal and crossing the MA again going upwards.
Trading Opportunities
The index price is expected to follow this known volatile path with large moves upward and downward since several speeches by the U.S. financial regulators are taking place almost every day. Additionally, the banking crisis and rate hike-related announcements cause turmoil in the stock market. Opportunities arise in reversals. As shown on the chart, the Fibonacci expansion can be used to find the 61.8% retracement level for going long after the end of the intraday shock at 100% Fibo level.
______________________________________________________________________
COMMODITIES MARKETS MONITOR
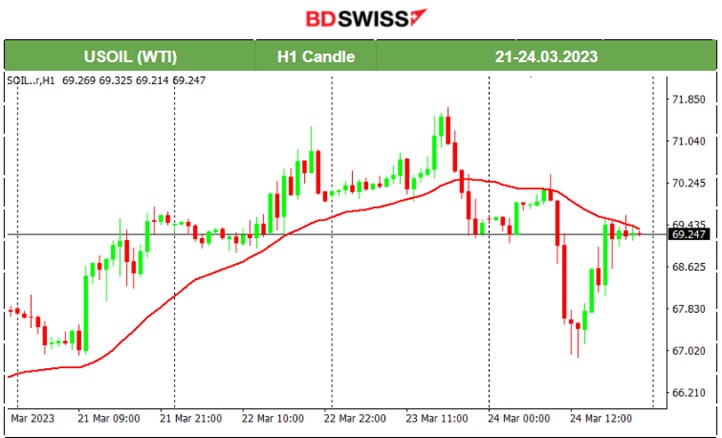
USOIL (WTI) 4-Day Chart Summary
Server Time / Timezone EEST (UTC 03:00)
Price Movement
US Crude Oil price has been rising the past few days. On the 23rd of March, the price experienced a fall and reversed below the 30-period MA. It was about to stabilise near the 70 USD level but on the 24th of March, volatility continued with the CFD price falling close to 67 USD and then retracing back to 69 USD.
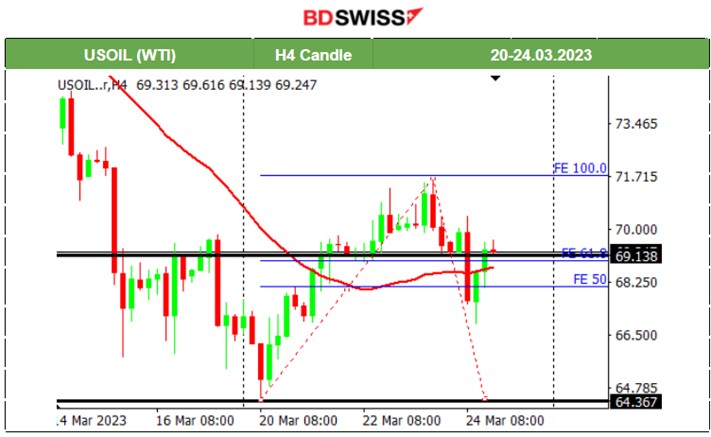
USOIL (WTI) 23.03.2023 Chart Summary
Server Time / Timezone EEST (UTC 03:00)
Price Movement
It seems that the support level of 69 USD was significant for crude Oil since breaking that level the market followed a drop of the size of 2 USD per barrel, which is relatively high for the day. Retracement followed back to 69, confirming high volatile conditions for the crude oil market.
Trading Opportunities
The chart below shows the upward movement of the U.S. Oil from the 20th until the 24th March and why there was an opportunity for capturing the retracement. We can see clearly that the price was moving with high speed upwards signalling a shock that at some point will end and a retracement will follow. Going short after breaking the support levels would be appropriate since the market reached even the 50% Fibo level.
Our Technical Analysis here: https://www.tradingview.com/chart/USOIL/EUWIMJU5-USOIL-Retracement-below-70-24-03-2023/
______________________________________________________________________
News Reports Monitor – Today Trading Day 27 March 2023
Server Time / Timezone EEST (UTC 03:00)
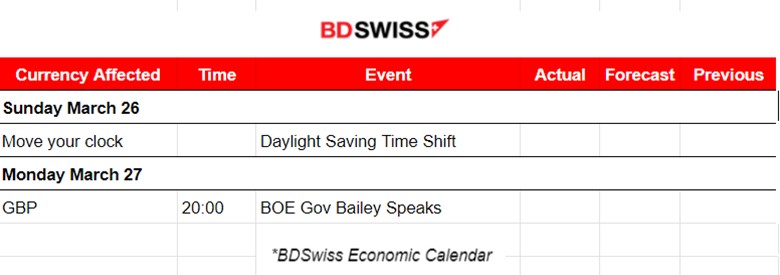
26 March 2023:
European countries use EEST in the summer and EET in the winter.
27 March 2023:
- Midnight – Night Session (Asian)
No important figures/release> No major impact.
- Morning – Day Session (European)
There are no important scheduled news announcements or figures to be released. No intraday shocks are expected. The market for most pairs will be characterised by low volatility and any major moves will be the result of price corrections back to the mean (30-period MA) or retracements.
- Evening – Night Session (North America)
At 20:00, the Bank of England Governor Andrew Bailey is speaking at the London School of Economics. U.K. inflation rose unexpectedly for the first time in four months. The Bank of England raised the interest rates by a quarter point to 4.25%. In an interview with BBC on Friday, Governor Bailey said that “There is evidence of encouraging progress on inflation”.
General Verdict:
- The GBP pairs are moving sideways following the recent developments, with high volatility.
- We do not expect to see significant long-term moves for GBP in either direction and no significant intraday shocks this day, 27th March.
______________________________________________________________________
Source: BDSwiss