 Rates as of 05:00 GMT
Market Recap
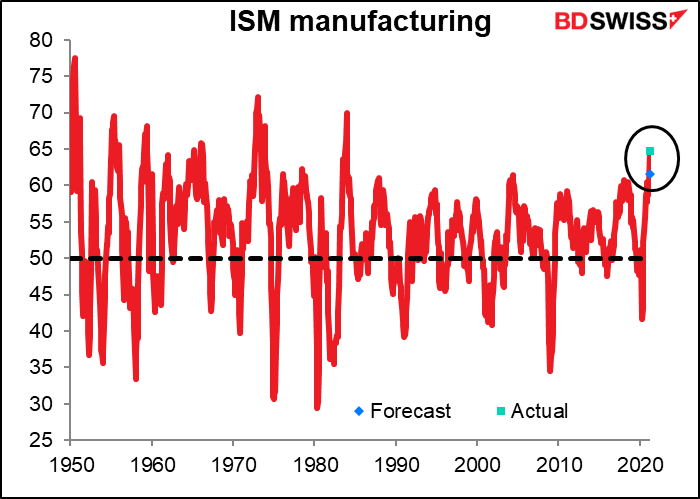
Proof that good news for the US economy is not necessarily good news for the dollar: the closely watched US Institute of Supply Management (ISM) manufacturing purchasing managers’ index (PMI) blew out estimates, rising to 64.7 from an already-high 60.8. This was the highest since 69.9 in December 1983. Yet the dollar declined on the day.
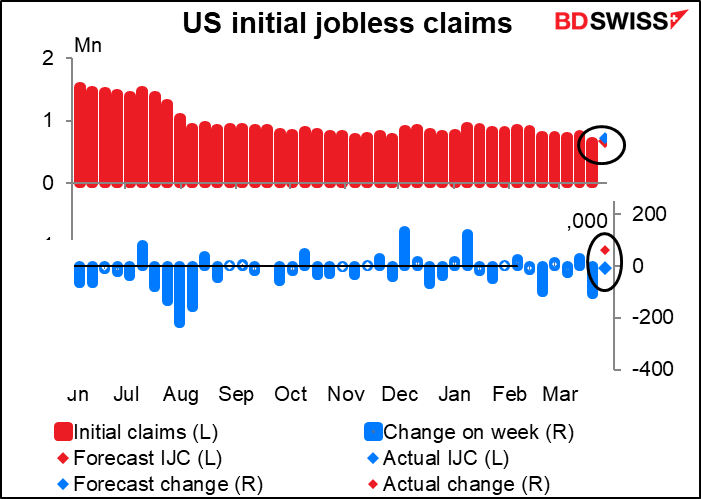
On the other hand, it could’ve been the disappointing initial jobless claims figure, which rose by 61k to 719k instead of falling by 9k to 675k as expected. (Pardon the disarray in the labels in the graph below, but there seems to be no good way that I could figure out to get them aligned properly.)
Yet looking at the graph of EUR/USD, the pair actually fell slightly immediately following the jobless claims number (i.e., USD strengthened). It was also falling before the ISM figure came out but got a big boost upwards (i.e, USD weakening) when it was released. In other words, the key here seems to be “risk-on” and “risk-off” rather than good or bad for the US economy.
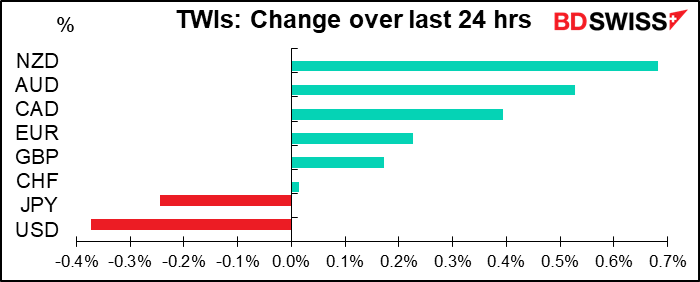
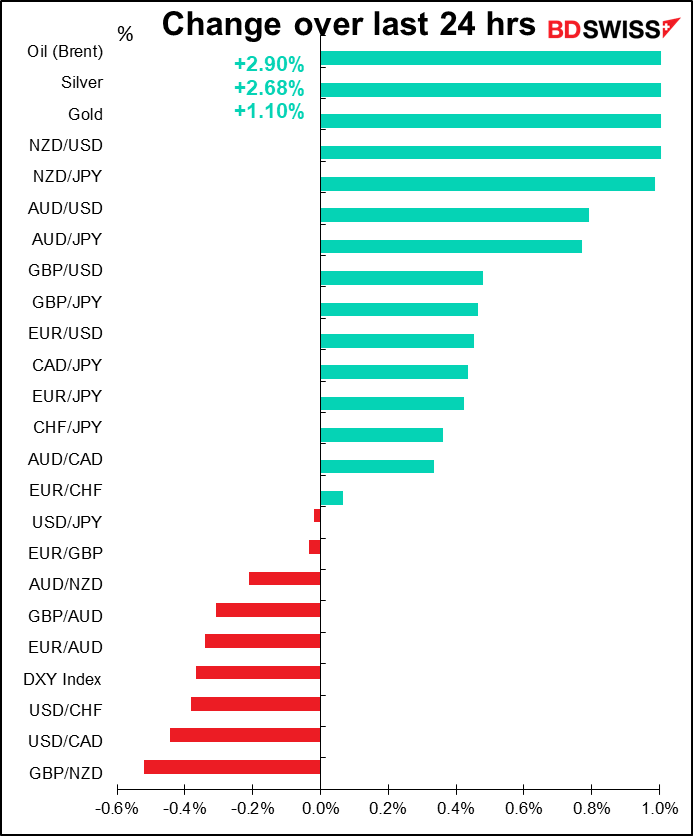
Accordingly, the three worst-performing currencies were the three “safe-havens,” USD, JPY & CHF, while the best-performers were the three commodity currencies: NZD, AUD, and CAD.
The US stock market certainly took the message to heart, with both the S&P 500 and the NASDAQ gaining sharply (1.2% and 1.8%, respectively). The S&P 500 broke through the magic 4,000 level for the first time to close above that previously unimaginable level. The NASDAQ is still 4.4% below its Feb. 12 high.
Surprising developments in oil: the price rose even though OPEC surprised the market (well, surprised me at least) by agreeing to increase output gradually over coming months: 350k barrels a day (b/d) in May, 350k b/d again in June, and 450k b/d in July = 1.15mn b/d total by July. On top of this, Saudi Arabia will gradually roll back its voluntary 1mn b/d cut = 250k b/d in May, 350k b/d in June, and 400k b/d in July = 1.0mn Total = an increase of 2.15mn b/d supply by July.
Why did this decision send prices higher when the market was looking for no increase at all? Because the increases are gradual and, most importantly, reversible. They can stop the increases or even unwind them at their next meeting on April 28th.
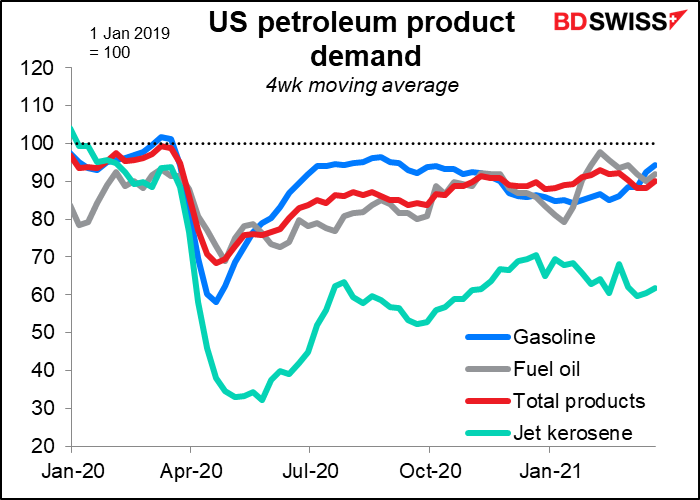
Meanwhile, despite the further lockdowns in Europe, there are signs of increasing demand in the US. As the economy recovers, people have been moving around more again.
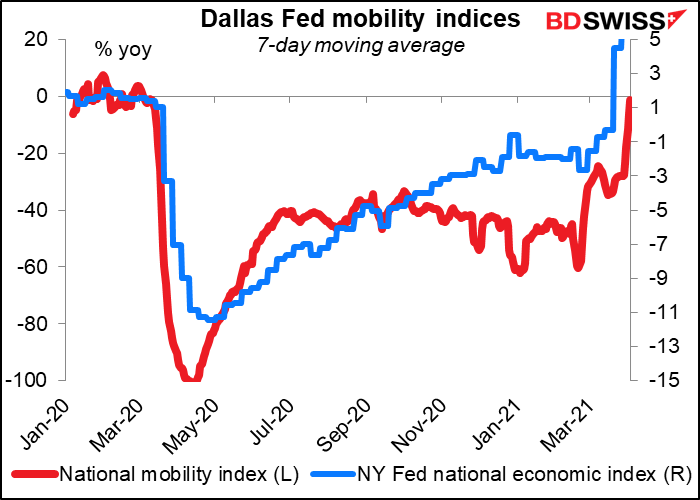
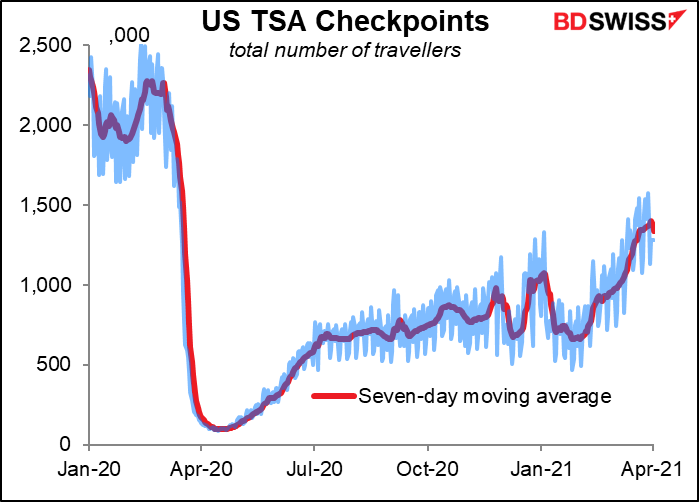
Air passengers in the US have skyrocketed (so to speak) in the last few weeks. It’s not back to pre-pandemic levels yet but it’s getting there.
Accordingly, demand for petroleum products is also rising. That’s why OPEC thinks it can gradually increase production to match gradually increasing demand.
Today’s market
Note: The table above is updated before publication with the latest consensus forecasts. However, the text & charts are prepared ahead of time. Therefore there can be discrepancies between the forecasts given in the table above and in the text & charts.
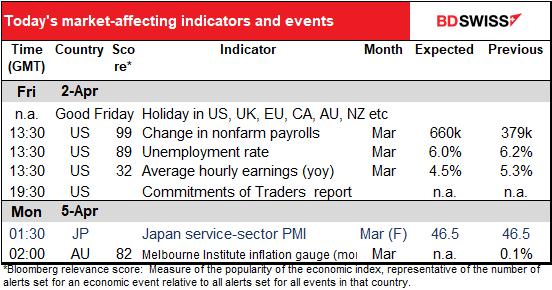
It’s likely to be a quiet but potentially volatile day. The Good Friday holiday means Australia and New Zealand were closed overnight and most of Continental Europe plus the UK are closed today. The New York Stock Exchange is closed and it’s a half-day in the US bond market, but the US government is up and running and the monthly nonfarm payrolls will be announced. That means the figure will land in a market thinned out by the holiday. Sometimes it means less movement as there are fewer people trading, but other times it can mean more movement if there happen to be one or two traders who want to deal in size when the market lacks depth and liquidity.
The market forecast for the NFP is 660k. The Bloomberg “whisper” number, an informal survey of Bloomberg customers, is a somewhat higher 800k. (This is just the guess of 106 Bloomberg clients so no real scientific value, but it does suggest where market sentiment may lie.)
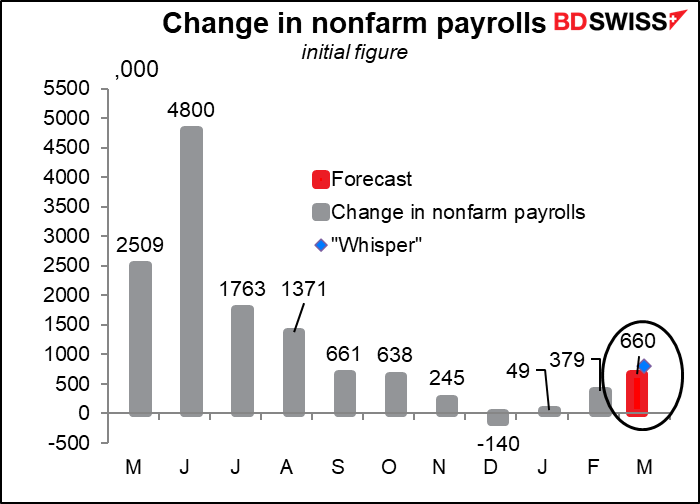
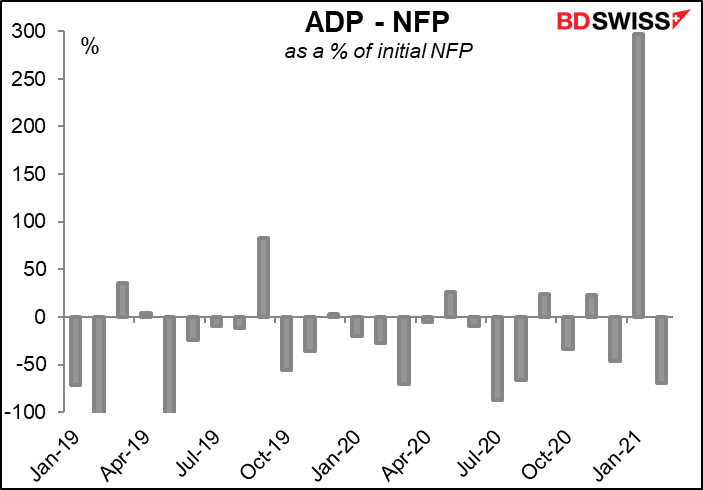
The ADP report however was a somewhat lower 517k. The difference between the ADP report and the initial NFP recently has been fairly normal, except for last January, when the ADP figure was much higher than the ADP in percentage terms ( 195k vs 49k). As it turns out the ADP’s figure was a much better forecast of the final, revised NFP figure – 166k — than the initial NFP figure was.
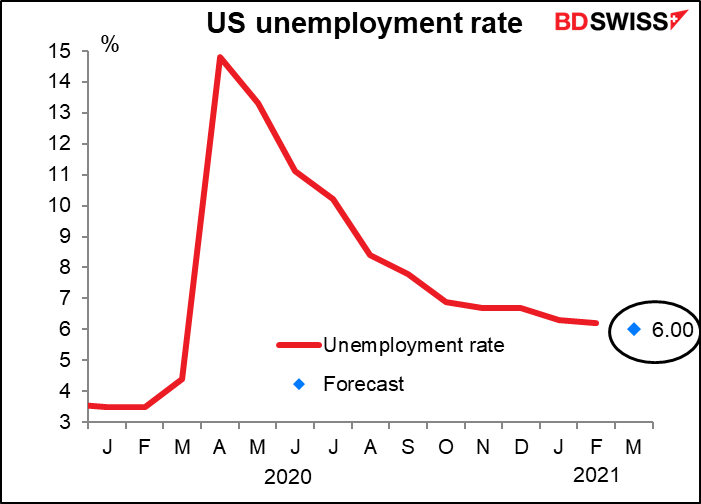
The unemployment rate is expected to come down to 6.0% from 6.2%.
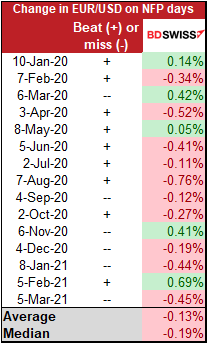
Everyone watches the NFP figure closely, but how much does it really matter? It seems that whether it misses or beats the market consensus, EUR/USD tends to go down (10 of the last 15 times). Of the five times when it went up, the NFP missed estimates twice. And while the NFP has beaten estimates 9 times since January 2020, EUR/USD only declined on six of those occasions. In other words, the movement of the market in the hours after the figure is released doesn’t always accord with what one might expect.
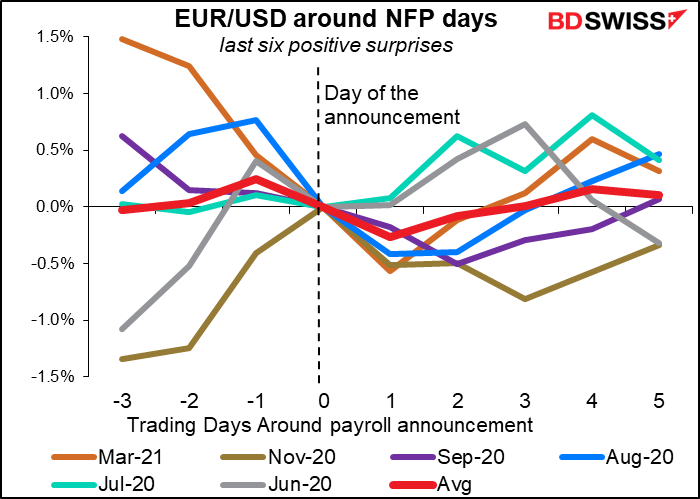
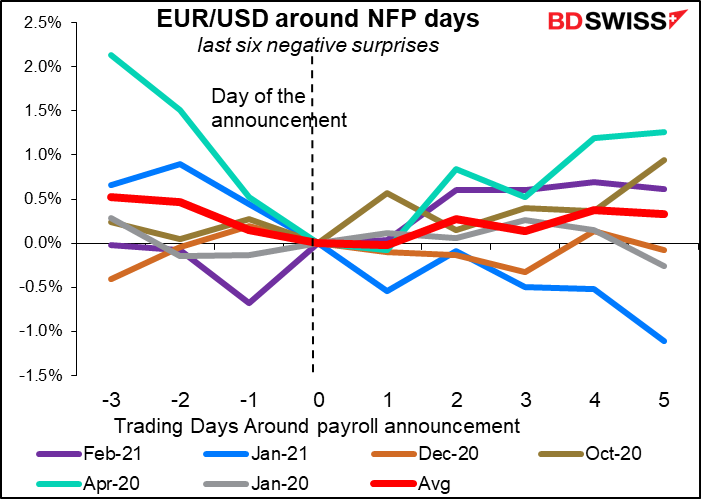
It’s even more so if we look at the few days after the announcement. Looking a day after the last six positive surprises, EUR/USD was indeed lower four out of six times and more or less unchanged twice. But a week later that impact had faded and it was higher twice, lower twice and unchanged twice – pretty much random.
Looking at the last six times when the data missed expectations, EUR/USD was significantly higher once, lower once and more or less unchanged four times. Here the effect may have been longer-lasting though; a week later it was higher four times, unchanged twice and lower (i.e., USD stronger) only once.
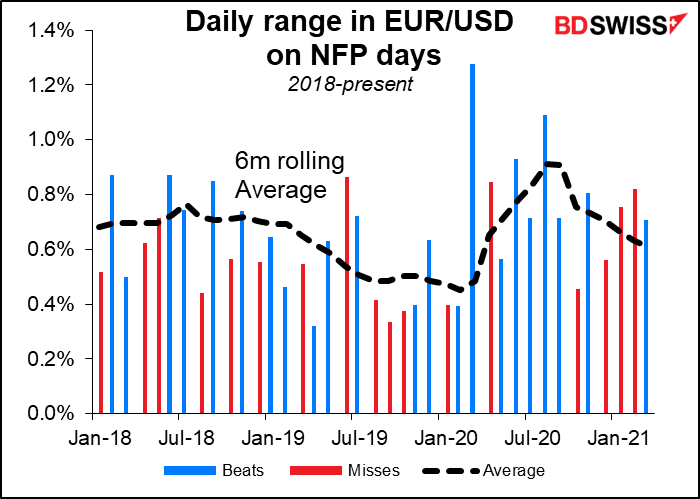
We can see that recently, EUR/USD has generally been less volatile on NFP days than on other days.
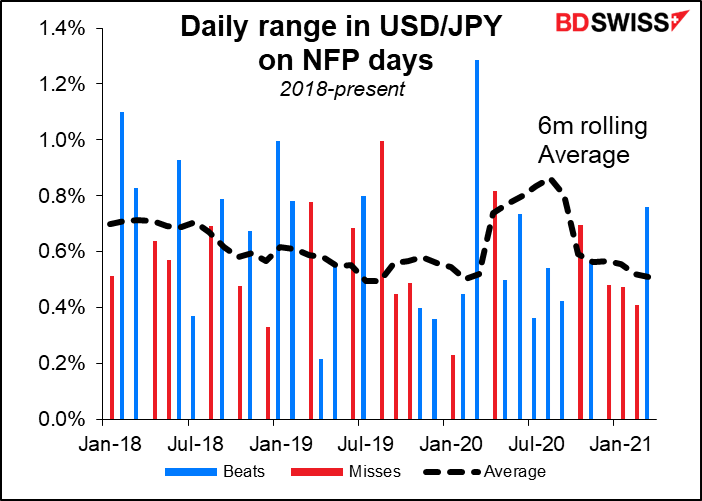
Ditto with USD/JPY. That wasn’t the case back in 2018 and 2019, but it generally has been for the last year or so.
That may be because of the Fed’s frozen reaction function. Fed policy is already at maximum loose, or almost so; they aren’t likely to loosen further unless there is a significant weakening of the labor market or drop in inflation, especially now that the Biden Administration is busy handing out dollar bills on street corners.
Meanwhile, the recovery in jobs that has taken place hasn’t been anywhere near enough to get US employment back to “levels consistent with the Committee’s assessments of maximum employment,” which is what they’d need to see before raising rates. There were 158.7mn people in the labor force at its peak in December 2019; at the bottom, in April last year, there were only 133.4mn, a drop of 25.4mn. Since then, the US has recovered 16.9mn jobs but that still leaves us 8.5mn below the previous peak. And when the labor market was at its peak back in December 2019, the personal consumption expenditure (PCE) deflator, the Fed’s preferred inflation gauge, was running at only 1.6% yoy. That’s below their-then 2.0% target, much less their new target of “moderately above 2 percent for some time.” So even the previous highest level of employment might not actually be “maximum employment,” if “maximum employment” is defined as the highest level of employment the economy can achieve without excessive inflationary pressures.
In short, it’s going to be a long time before the employment picture improves enough to cause a change in monetary policy. That’s probably why the NFP figure isn’t having the kind of impact on the FX market that it used to.
Source: BDSwiss