Rates as of 05:00 GMT
Market Recap
It’s always surprised me that the market keeps reacting to the same news over and over again, as if it’s stuck in a Groundhog Day – type loop. Yet it seems that whenever officials say the same thing that they said last week, the market reacts all over again. In this case it was Fed Vice Chair Clarida saying that the Fed isn’t ready to start normalizing policy yet. “Through that April employment report, we have not made substantial further progress,” Clarida said Monday. (Remember that “substantial further progress” is what they’ve said they need to see before they can start adjusting policy.) “As we go through the year,” policy-makers will weigh the data and “we will certainly give advance warning before we anticipate scaling back the pace of those purchases.”
Nothing new here from my point of view, but perhaps just the fact that he didn’t say anything different – or maybe that he emphasized the lack of progress in employment instead of the more-than-expected progress on inflation – reassured the market. On the contrary, he seemed to accept that higher inflation was likely in the near term. “The way in which we bring supply and demand into balance in the labor market, especially in the service sector, may take some time and may produce some upward pressure on prices as workers return to employment,” Clarida said. “ We have to be attuned and attentive to that data flow.”
Yet US bond yields rose on the news – probably because it signals the Fed is willing to tolerate higher inflation (which should come as no surprise to anyone, either). Ten-year breakeven inflation rate rose 2.6 bps while 10-year yields were up 2.0 bps.
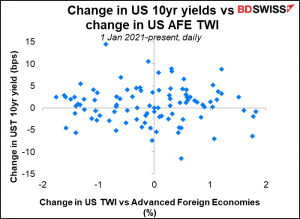
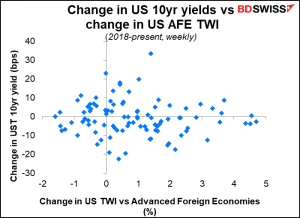
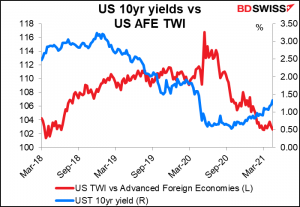
I was wondering if it’s unusual to see the dollar sink like this when US bond yields move higher, but in fact there’s no stable relationship between the day-to-day change in US bond yields and the change in the dollar, nor on a weekly basis either.
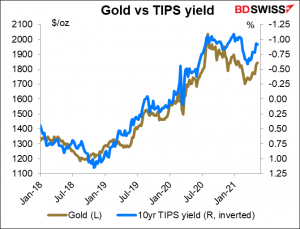
Gold however does seem to be benefitting from the higher inflation expectations, although here again there’s no day-to-day correlation (not shown).
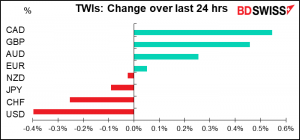
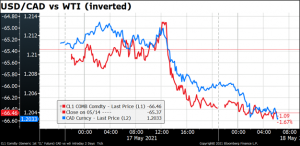
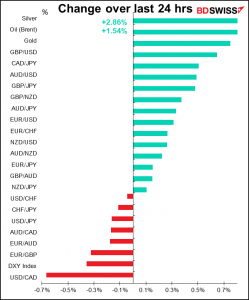
Meanwhile with oil up 1.5% I don’t really have to explain why CAD is the top gainer today, do I? (“CL1” is the price of the nearest West Texas Intermediate (WTI) crude oil contract, inverted in this graph so it follows USD/CAD.)
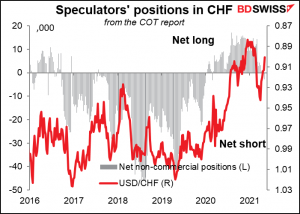
As for CHF, I’d like to say that the decline is due to yesterday’s report of the 2nd consecutive sharp rise in Swiss sight deposits, indicating that the Swiss National Bank is on the ball and watching the rise in EUR/CHF with alarm.
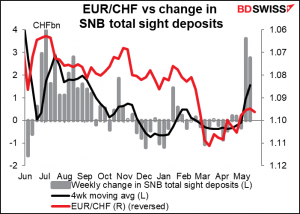
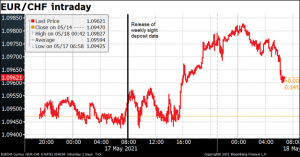
However, the fact is that the sight deposits are released at 08:00 GMT and USD/CHF actually fell a bit after that; it didn’t really start taking off until 15:40 GMT. So, it’s hard to pin the blame on that.
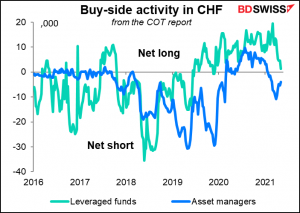
Maybe it’s because speculators have started to go net short CHF
As have asset managers. And hedge funds have been trimming their CHF longs.
Today’s market
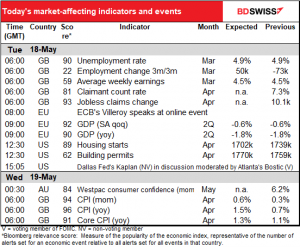
Note: The table above is updated before publication with the latest consensus forecasts. However, the text & charts are prepared ahead of time. Therefore there can be discrepancies between the forecasts given in the table above and in the text & charts.
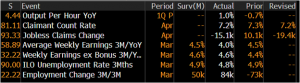
The UK employment data is already out. It was better than expected, with the unemployment rate down 1 tick vs expected unchanged and employment rose more than expected.
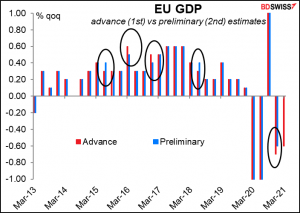
So not that much else during European time. The second estimate of EU 2Q GDP is rarely revised, and if it is, it’s only ±0.10 percentage point usually, so no big deal. I’m not even going to bother with a graph, and usually I make a graph of virtually everything, so that shows you how little importance I put on this. Ok you convinced me. I’ll include a graph.
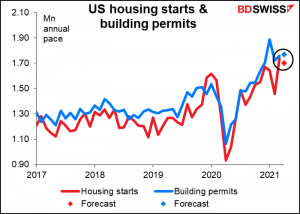
US housing starts are expected to be down a bit (-2.1% mom) but building permits are expected to be up a little ( 0.6%). Both are at such high levels – the highest since the housing boom of 2002-06 – that this small movement isn’t significant.
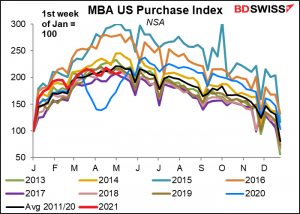
Although the Mortage Bankers’ Association (MBA) mortgage applications index has peaked relatively early this year (red line), suggesting that perhaps demand has plateaued for the time being following the surge last year. But with mortgage rates still low, houses are still affordable and so demand is likely to continue strong, IMHO.
Then we wait for the talkative Dallas Fed President Kaplan to tell us once again why the Fed should start talking about tapering its bond purchases. C’mon Bob, think up something new, please?
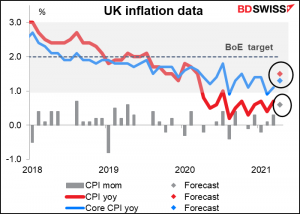
After which we can pretty much go to sleep, until we wake up in the morning with the radio on, just in time to catch the another early UK indicator: the UK consumer price index (CPI). It’s expected to rise further, into the Monetary Policy Committee (MPC)’s 1%-3% area of tolerance. A rise in inflation back into the target zone could accelerate thoughts that the Bank of England might start normalizing policy one of these days, which would be positive for the pound (see the Weekly Outlook for details).
Source: Marketwatch