Rates as of 05:00 GMT
Market Recap
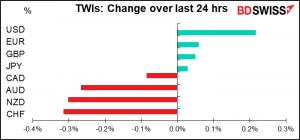
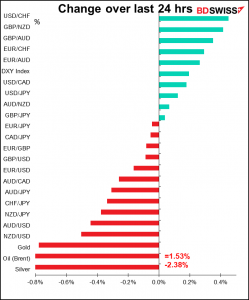
The market giveth, the market taketh away. Yesterday CHF was the #1 performer, today it’s at the bottom of the table. Did the Swiss National Bank (SNB) read my comment and decide that it had to make its presence felt to prevent a bandwagon effect from starting? We’ll find out next Monday.
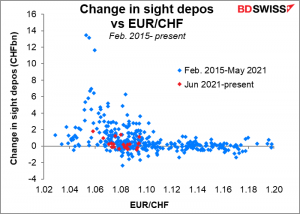
Meanwhile I decided to take a look at the history of how Swiss sight deposits change at different levels of EUR/CHF. I started in February 2015, because before then the SNB was defending the 1.20 EUR/CHF floor. What I found was that while the recent intervention hasn’t been the lowest ever at these levels, it has definitely been at the low end. If they keep being only moderately involved then we’ll know that this is indeed just a “smoothing” operation.
Of course the fact that it was generally a risk-on day in stock markets also may have helped to depress CHF, although the global mood didn’t impact JPY that much. That was a bit surprising given that the Bank of Japan announced that BoJ Gov. Kuroda and Japan’s new government had confirmed their commitment to the 2013 pledge to cooperate on achieving the 2% inflation goal. This commitment, which is about as believable as Chiang Kai-Shek’s pledge each year to retake the Chinese mainland, at least confirms that the BoJ won’t be going along any time soon with the global shift toward normalizing monetary policy – implying the return of the yen carry trade and a weaker JPY.
Getting back to stock markets…several market indices climbed further into record territory, e.g. S&P 500 ( 0.4%), the NASDAQ ( 0.3%), the Dow Jones Industrials ( 0.3%), and Europe’s Euro STOXX 600 ( 0.1%) all hit record highs. France’s CAC 40 ( 0.5%) finally beat its previous record close from September 2000. Stock markets are being boosted by positive earnings reports as 27 of 29 S&P 500 companies reporting earnings during trading hours and 16 of 20 reporting after-hours beat estimates.
While stock markets were rising, bond yields were falling around the globe, perhaps as a result of the Reserve Bank of Australia’s relatively dovish tone yesterday. Ten-year Treasury yields fell 1.4 bps to 1.54% while European yields fell even more as investors reconsidered the likelihood of the European Central Bank hiking rates any time soon.
Another anomaly: not only were the commodity currencies lower on this risk-on day, but CAD outperformed NZD and AUD despite a fall in the price of oil. CAD may be benefitting from expectations of good employment data on Friday and the likely Bank of Canada reaction to an improving economy.
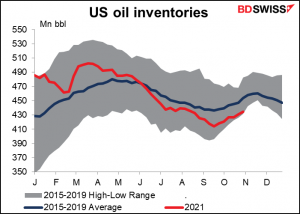
Oil was lower after the American Petroleum Institute (API) reported the sixth consecutive week of crude oil inventory builds. At 3.6mn barrels it was higher than what the market expects from this afternoon’s US Dept of Energy figures.
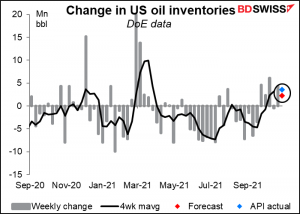
Still, plugging that number into the Dept of Energy figures, inventories are historically low for this period and are some 57mn barrels lower than they were at the beginning of the year. So it’s too much to say that the US oil crunch is ending. I think oil prices are still headed higher, and CAD with them.
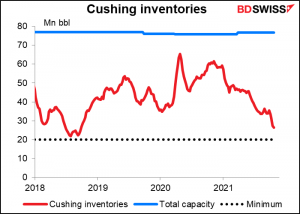
Another anomaly: at the same time as overall inventories were rising, inventories at the main US distribution point of Cushing, Oklahoma fell by a further 882k barrels. They are down some 32.8mn barrels this year and getting perilously close to the minimum 20mn barrels that the depot needs to have to operate smoothly. The reason both of these phenomena can happen at the same time is that the US imports foreign oil too.
Today’s market
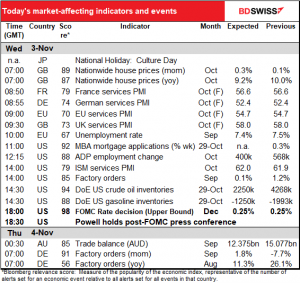
Note: The table above is updated before publication with the latest consensus forecasts. However, the text & charts are prepared ahead of time. Therefore there can be discrepancies between the forecasts given in the table above and in the text & charts.
Nothing will happen today. Everyone will be frozen in place like in the first episode of Squid Games while they wait for tonight’s meeting of the Federal Open Market Committee (FOMC), the rate-setting body of the US central bank, the Federal Reserve.
As usual, I gave a detailed explanation of what I expect in my fulguratingly brilliant Weekly Outlook, “Transitory” Proves Transitory. Again as usual, I’ll summarize my views here:
I expect them to announce that they will start tapering down their monthly bond purchases. They’re likely to cut their $120bn-a-month purchases by $15bn a month, which would end the program around June of next year, in line with Chair Powell’s comments that “a gradual tapering process that concludes around the middle of next year is likely to be appropriate.” They’ll probably lay out the taper schedule while stressing that it’s flexible (“the Committee will likely reduce the pace of asset purchases in further measured steps at future meetings. However, asset purchases are not on a pre-set course…” is what they said when they last started tapering back in Dec 2013.)
The big question for me is, what do they do with the line in the first paragraph of the statement that reads, “Inflation is elevated, largely reflecting transitory factors.” Generally speaking, central banks don’t like to make sudden changes in their stance, so I’d expect them to leave in the word “transitory” but note that supply constraints and shortages may keep inflation elevated into next year. There’s likely to be talk about “monitoring inflation carefully,” “carefully” being a code word signifying that the Committee is on high alert about something.
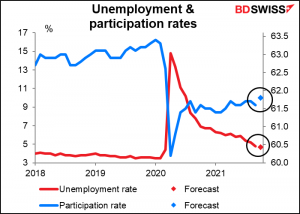
Regardless, I would expect Powell & Co. to stress that “lift-off” – the first rate hike – will not necessarily follow on the heels of the end of the bond purchases. That requires more than just “substantial progress;” it would require “maximum employment.” I don’t know for sure what the Committee thinks maximum employment is, but their median forecast for unemployment in 2023 and 2024 is 3.5%, equal to the Sep. 2019 low (lowest since 1969), so my guess is that’s as low as they think it can go. In any event, I’d guess that an unemployment rate of 4.7% (as forecast for Friday’s US employment data) and in particular a participation rate of 61.8% are nowhere near it.
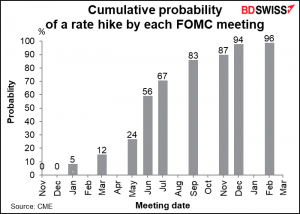
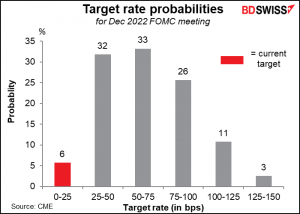
Currently the market has a more aggressive view on rates than the Fed does for next year and 2023. The market sees a good chance of the first rate hike coming right after tapering ends next June, or at the latest July, with a good chance of a second hike later in the year – even a 26% chance of three hikes next year.
Last week we saw ECB President Lagarde push back on the market’s more aggressive pricing for euro rates, and yet EUR/USD rose because she didn’t push back hard enough. In this case, I expect Powell to push back even less aggressively. Half of the 18 Committee members said in September that they expect at least one rate hike next year (of whom three expected two hikes) and their view on inflation has probably become even less certain since then. If Powell retreats from his “transitory” mantra and admits the possibility that the market is correct, we could see rate expectations for 2023 and especially 2024 rising. That could push the dollar higher.
Today’s indicators
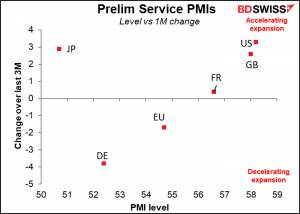
Monday we got the final manufacturing sector purchasing managers’ indices (PMIs), today we get the final service-sector PMIs. These are the more important ones now as the service sector was hit harder than manufacturing was by the pandemic. All of the preliminary service-sector PMIs were in expansionary territory in October – for Japan, the first time since the pandemic began — but the decline in Germany was worrisome.
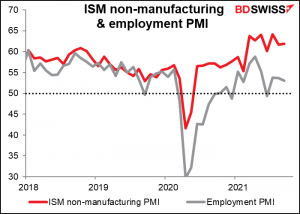
Later in the day we’ll get the Institute of Supply Management (ISM) version of this index for the US. It’s expected to be effectively unchanged at a level somewhat higher than that of the Markit version, which would be a good sign and maybe positive for USD.
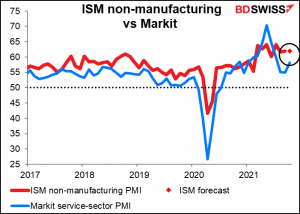
People will be particularly watching the ISM non-manufacturing employment PMI, because service-sector employment is the bulk (84%) of US private-sector employment.
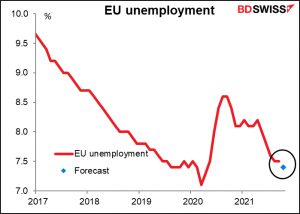
We had German unemployment last Thursday, now it’s time for EU-wide unemployment. As usual, Germany’s indicator is more important than the EU-wide indicator (a Bloomberg relevance score of 87 vs 67). German unemployment fell by a bit more than expected (-39k vs -20k expected) while the unemployment rate was in line with expectations at 5.4%, down from 5.5% the month before. Now the market is looking for a small drop in EU-wide unemployment. I don’t think this will move the needle for any policy-makers though so it’s probably not that important for the FX market.
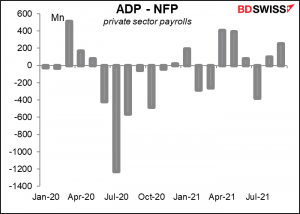
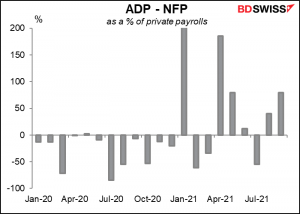
The ADP Employment Report is, though! Automated Data Processing Inc. (ADP) is an outsourcing company that handles about one-fifth of the private payrolls in the US, so its client base is a sizeable sample of the US labor market as a whole and its figure is therefore looked at as a guide to Friday’s nonfarm payroll (NFP) figure. One point to note: it adjusts the figures in an attempt to match them to the final estimate of the NFP private payrolls, not the initial estimate of total payrolls (including government). So while they are one of the best guides to the NFP that we have, they aren’t perfect by any means – in fact, neither is the NFP figure itself, since it’s always revised.
In any case, the forecast for the ADP report this month, 400k, is exactly the same as the forecast for the NFP private payrolls figure.
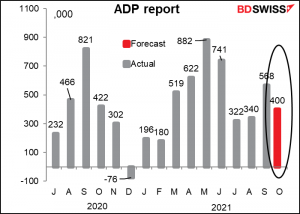
Just to repeat as always though, the ADP report is not a reliable guide to the NFP figure. Last month for example the ADP report was higher than expected at 568k (430k expected) and everyone got excited about the NFP in the event the NFP figure was lower than expected at 317k (450k expected). Of course that initial NFP figure could be revised up on Friday.
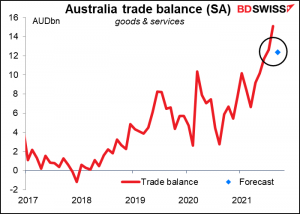
Overnight Australia releases its trade data. The trade surplus is expected to retreat from its record high in August.
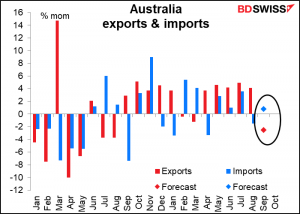
Imports are expected to be up while exports are expected to be down.
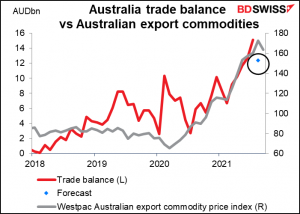
The trade surplus is expected to fall even with a further rise during the month in the prices of the commodities that Australia produces. Prices fell in October though so we’re likely to see the trade surplus fall further. This could be a headwind for AUD.
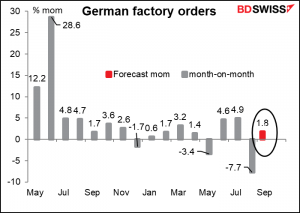
Then, as the European day gets underway, Germany announces its factory orders. They’re expected to show only a small rebound after August’s sharp decline. Of course the August decline came after two consecutive months of strong gains. Industrial production was also down in August too. The auto sector accounted for half of the contraction in German industrial production in August, so perhaps it’s also dampening new orders too. No point in building cars if you don’t have the microchips to run the electronics in them and no point in buying new equipment or parts if you can’t build the cars.
In any case, don’t get too concerned because this would still leave orders 8.9% above the pre-pandemic level or 11.2% above 2019 average, so they’re still pretty strong.
Source: BDSwiss