Rates as of 06:00 GMT
Market Recap
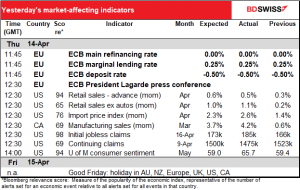
Another day of “monetary policy divergence.” The European Central Bank (ECB) met yesterday and did exactly what was expected of them, i.e. nothing. They confirmed and somewhat strengthened their commitment to end net asset purchases in Q3 but that’s about all.
By contrast, several Fed speakers made comments that sent US rate expectations up further. In particular, New York Fed President Williams (voter) said hiking rates by 50 bps was “a reasonable option for us because the federal funds rate is very low.” “We do need to move policy back to more neutral levels,” he said.
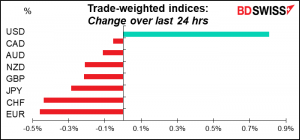
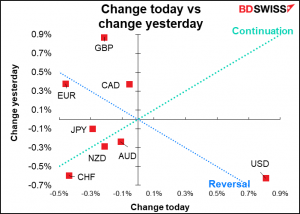
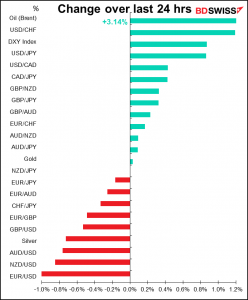
The resulting contrast sent USD up and EUR down.
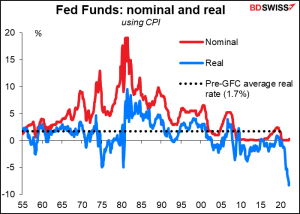
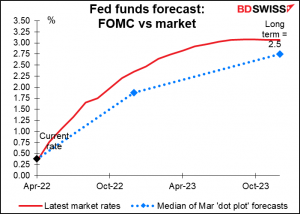
The big question is, does he mean neutral in nominal terms or real terms? The Fed estimates that neutral in nominal terms would be around 2.5%, but neutral in real terms would be significantly higher. As it stands now, the real fed funds rate is the lowest it’s been since…well, since there was a fed funds rate. To get the real fed funds rate back up to the level that prevailed before the Global Financial Crisis in 2008 would require some 950 bps of tightening! That would surely send the US economy crashing.
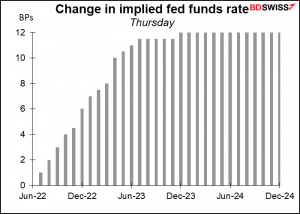
In any event, the market’s expectations for Fed interest rates keep rising. The market now believes that the Fed is literally “behind the curve” and will have to hike even more rapidly than FOMC members predicted just a month ago.
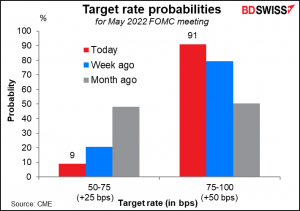
The market is now discounting a 50 bps hike at the May 5th meeting…
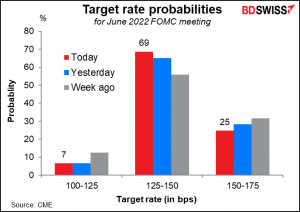
…and another 50 bps hike at the June meeting too, with a 75 bps hike seen as more likely than a 25 bps hike.
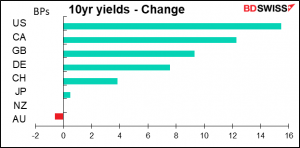
As a result, the US led global bond yields higher.
This “monetary policy divergence” theme is clearest with regards to USD/JPY, which broke through 126 to hit a 20-year high (May 2002 was the last time it was over 126).
At the same time, this is also a great example of the “money illusion” Since Japan’s inflation rate is so much lower than most other countries, the yen’s nominal value should have been rising just to keep its real value stable. The real effective exchange rate (the yen’s value against Japan’s major trading partners, taking into account inflation differentials) in February, the latest we have data for, was the lowest since February 1972, before the end of the Bretton Woods system!
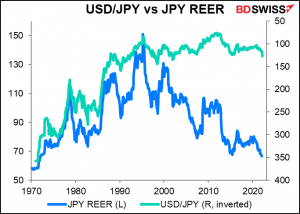
While from a purchasing power parity basis the yen is wildly oversold, that doesn’t have much impact on the market, which pays more attention to investment flows than trade flows.
I think the weak yen can weaken further unless the Bank of Japan decides to go along with the global trend and let interest rates rise. The thing we have to watch is their yield curve control (YCC) policy, which keeps the 10-year yield within a ±25 bps range of 0%. The yen probably won’t strengthen significantly unless and until they change that policy, in my view.
Today’s market
Note: The table above is updated before publication with the latest consensus forecasts. However, the text & charts are prepared ahead of time. Therefore there can be discrepancies between the forecasts given in the table above and in the text & charts.
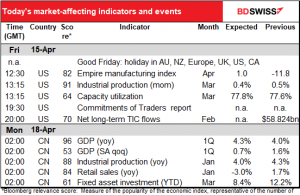
Today is Good Friday so most centers in Europe are closed. The US stock market is closed but the bond market operates until 2 PM New York time (1800 GMT). FX trading will be thin, but that could mean narrow ranges or it could mean wider-than-usual ranges if something big happens and the market lacks the liquidity to absorb it.
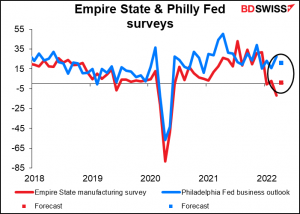
The US Empire State manufacturing survey (the Empire State being the state of New York) is expected to recover just barely into positive territory after last month’s surprise plunge (6.4 expected, -5.0 lowest estimate, – 11.8 actual). Meanwhile the Philadelphia Fed index (due out April 21st) is expected to fall to 21 from 27.4. Generally speaking, every month economists expect these two to converge so they forecast the lower one to rise and the higher one to fall. It does seem reasonable for the Empire State index to recover as many of the forward-looking sub-indices have been positive recently. In any case it will be good news if the Empire State index returns to positive territory, which would indicate an expansion in activity.
Speaking of an expansion in activity, US industrial production is forecast to rise 0.4% mom, which just so happens to be the same as the six-month moving average of this indicator. Oil & gas production have been increasing strongly while auto production rebounded a bit during the month, however electric utility output fell.
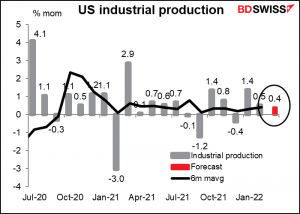
Together, a rebound in the Empire State index and a rise in industrial production in line with the recent trend should reassure markets that the US economy is still growing and might therefore be positive for the dollar.
Then early Monday, China announces its usual trio of retail sales, industrial production, and fixed asset investment, this time with the all-important GDP figures too.
GDP is expected to rise some 4.3% y0y, which would be a small rise from Q4 but certainly not back to normal for China.
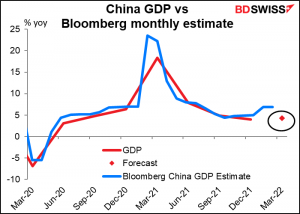
That may be because of the expected fall in retail sales, although industrial production is expected to pick up a bit.
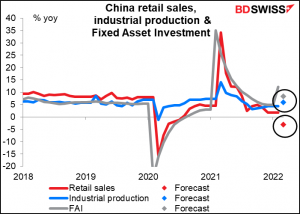
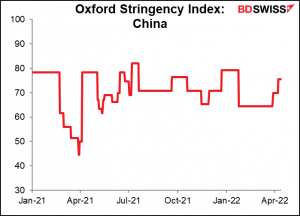
I think given the lockdown in Shanghai and the increasingly stringent measures being taken to get COVID-19 under control, Q1 growth will not be taken as indicative of Q2 growth and therefore I think the figures will have limited impact on the market. If anything I think the disappointing retail sales would be the standout figure and the data could therefore hit sentiment.
Source: BDSwiss