EURUSD, “Euro vs US Dollar”
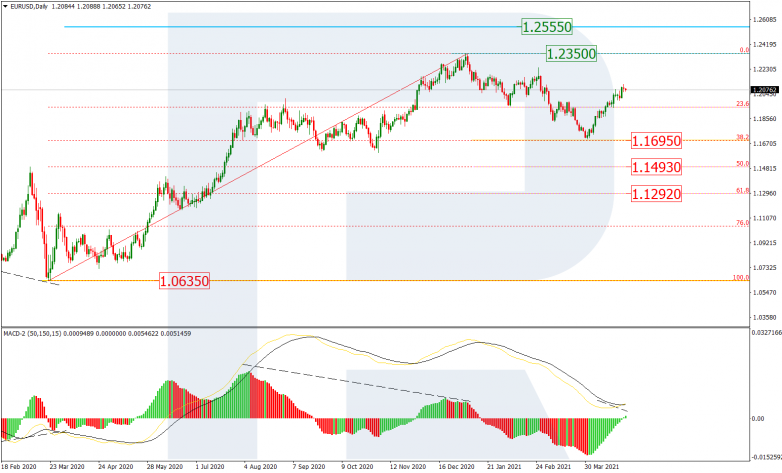
As we can see in the daily chart, after finishing the correctional decline at 38.2% fibo at 1.1695, the asset continues forming a stable rising impulse, which may be considered as a new wave within the long-term uptrend. The closest upside target is the current high at 1.2350, a breakout of which may lead to a further uptrend towards the fractal at 1.2555. At the same time, one shouldn’t exclude a possibility of another descending wave reaching 50.0% and 61.8% fibo at 1.1493 and 1.1292 respectively.

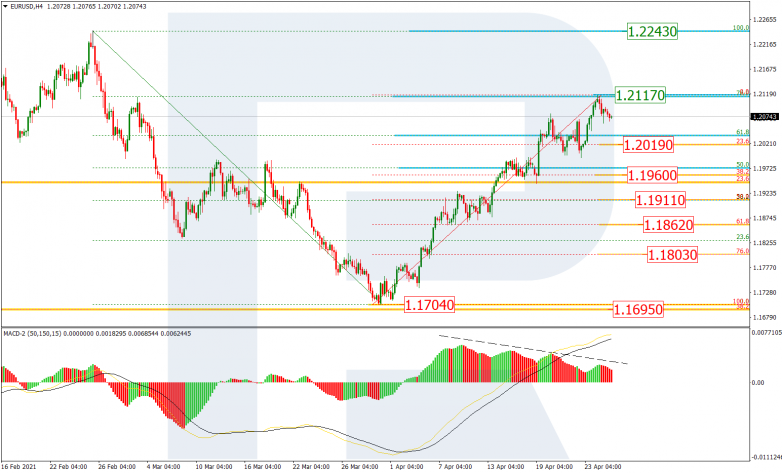
The H4 chart shows that the rising wave has reached 76.0% fibo. Despite the stable uptrend, there is a divergence on MACD, which may hint at a possible reversal downwards. In this case, the downside targets may be 23.6%, 38.2%, 50.0%, 61.8%, and 76.0% fibo at 1.2019, 1.1960, 1.1911, 1.1862 and 1.1803 respectively. however, the key downside target will be the local low and the mid-term 38.2% fibo at 1.1704 and 1.1695 respectively.

USDJPY, “US Dollar vs. Japanese Yen”
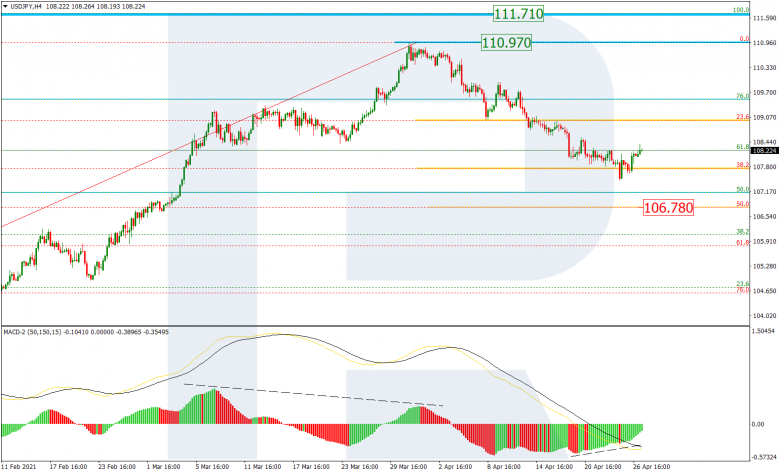
As we can see in the H4 chart, the pair is forming a steady downtrend. The price might have fallen and tested 38.2% fibo but a local convergence on MACD may indicate a new pullback or even a reversal. After the pullback, the asset may resume falling to reach 50.0% fibo at 106.78. Later, the market may complete the correction and start a new growth towards the high and the fractal high at 110.97. However, if the pair reverses, it may be heading to reach the high and the fractal high at 110.97 and 111.71 respectively.

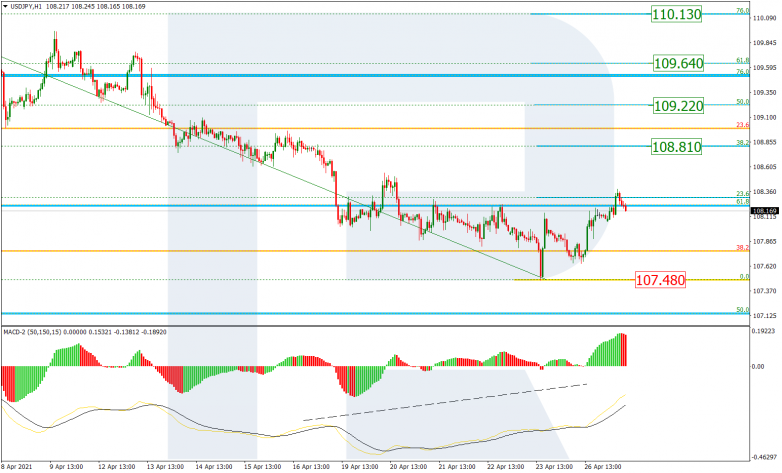
The H1 chart shows a new correctional growth after a convergence on MACD, which has already reached 23.6% fibo and may later continue towards 38.2%, 50.0%, 61.8%, and 76.0% fibo at 108.81, 109.22, 109.64, and 110.12 respectively. the support is the low at 107.48.