Brent
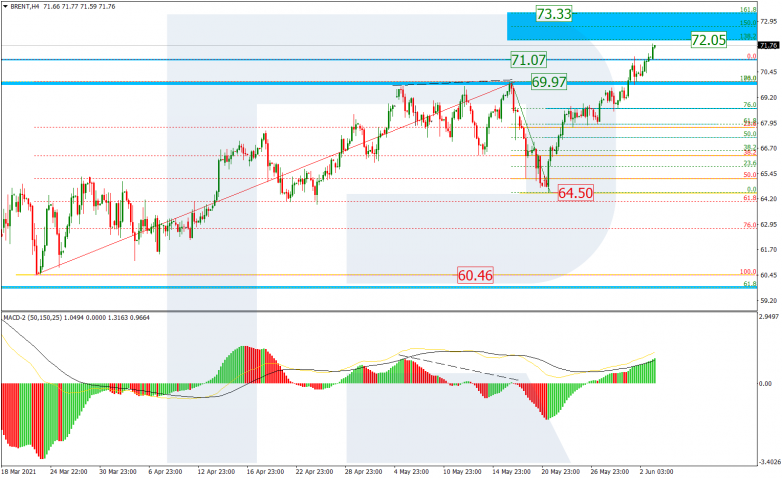
In the H4 chart, after completing the correctional downtrend at 50.0% fibo, Brent is steadily growing and has already broken both highs, local and long-term, at 69.97 and 71.07 respectively. Later, the market may continue growing to reach the post-correctional extension area between 138.2% and 161.8% fibo at 72.05 and 73.33 respectively. The support is the local low at 64.50.

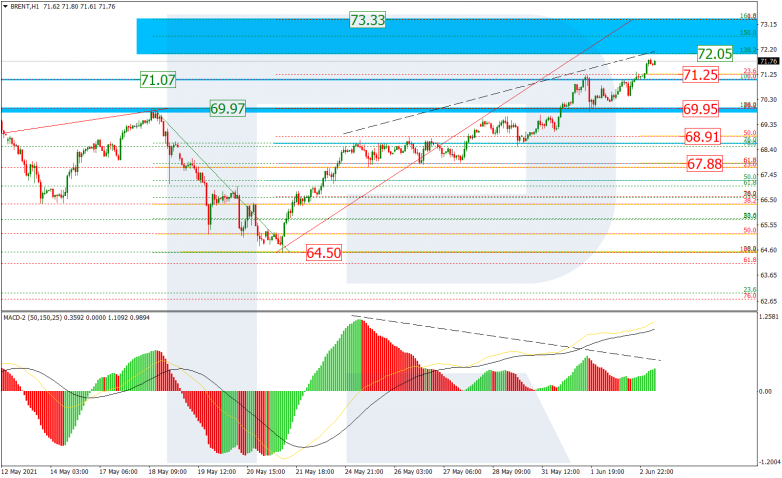
The H1 chart shows a more detailed structure of the current uptrend. At the same time, there is a divergence on MACD, which may hint at a possible pullback after the pair tests the upside border of the post-correctional extension area between 138.2% and 161.8% fibo at 72.05 and 73.33 respectively. The correctional targets may be 23.6%, 38.2%, 50.0%, and 61.8% fibo at 71.25, 69.95, 68.91, and 67.88 respectively.

Dow Jones
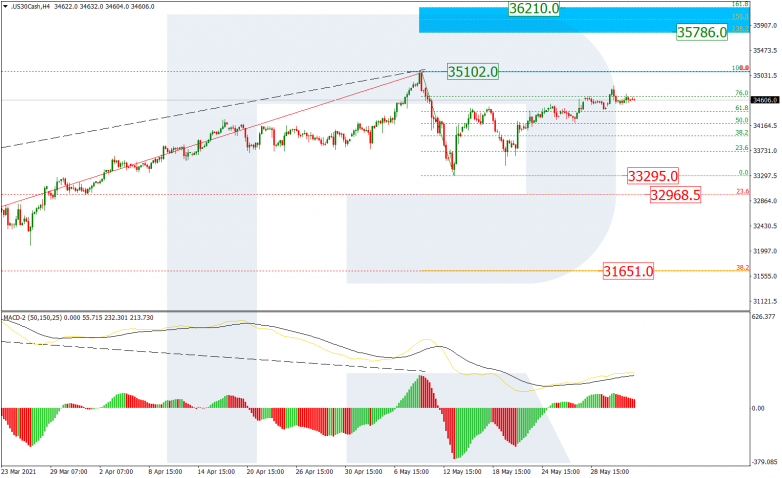
As we can see in the H4 chart, Dow Jones is slowing down a bit on its way towards the high at 35102.0. After completing the correction to the downside, the asset is moving upwards and has already reached 76.0% fibo. This rising wave is heading to break the high and then enter the post-correctional extension area between 138.2% and 161.8% fibo at 35786.0 and 36210.0 respectively. However, an alternative scenario implies a rebound from the high and a new mid-term correctional downtrend to break the low at 33295.0 and then mid-term 23.6% and 38.2% fibo at 32970.0 and 31651.0 respectively.

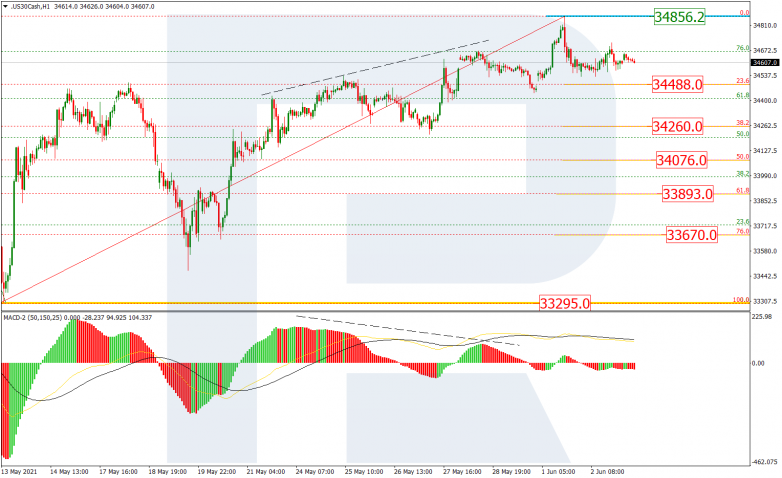
The H1 chart shows potential downside targets after a local divergence on MACD. The resistance is at 34856.2, At the moment, the index is falling and approaching 23.6% fibo at 34488.0. The next downside targets may be 38.2%, 50.0%, 61.8%, and 76.0% fibo at 34260.0, 34076.0, 33893.0, and 33670.0 respectively. Still, the key downside target is the local support at 33295.0.