EURUSD, “Euro vs US Dollar”
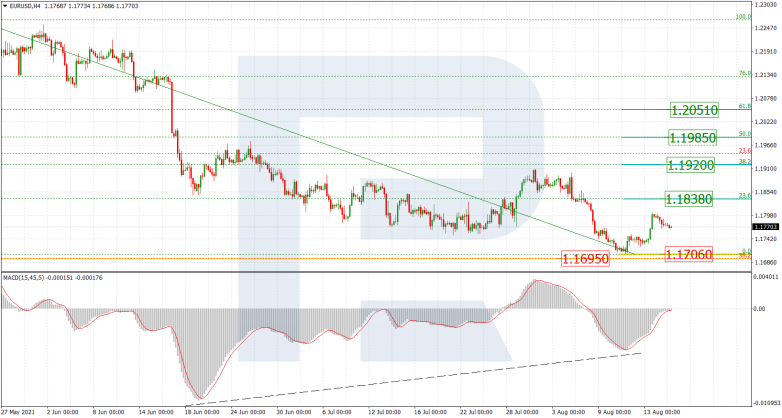
As we can see in the H4 chart, convergence on MACD prevented the asset from breaking 38.2% fibo at 1.1695; right now, it is correcting upwards. The closest target is 23.6% fibo at 1.1838, while the next ones may be 38.2%, 50.0%, and 61.8% fibo at 1.1920, 1.1985, and 1.2051 respectively. After that, the instrument is expected to reverse and forming a new descending wave to reach the current support, which is the low at 1.1706.


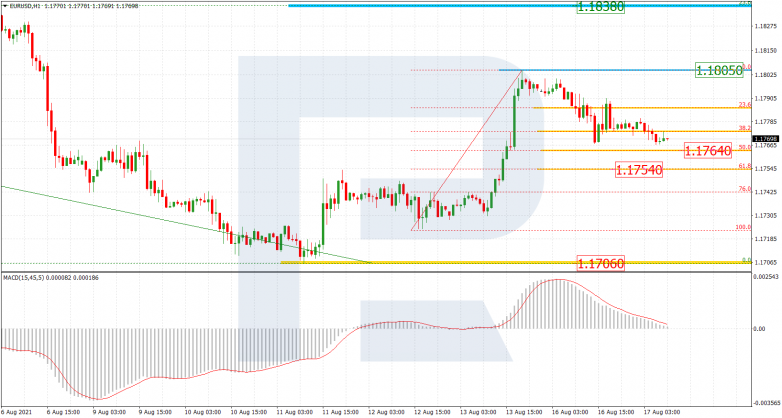
The H1 chart shows that a quick growth was followed by a local pullback, which has almost reached 50.0% fibo at 1.1764 and may later continue towards 61.8% fibo at 1.1754. After that, the asset may resume growing to reach the previous high at 1.1805.


USDJPY, “US Dollar vs. Japanese Yen”
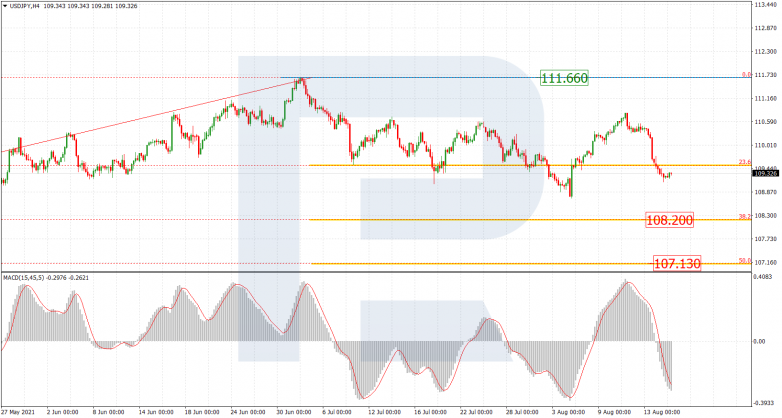
As we can see in the H4 chart, after completing the correctional uptrend, USDJPY is forming a new mid-term wave to the downside, which is heading towards 38.2% and 50.0% fibo at 108.20 and 107.13 respectively. The local resistance is still the high at 111.66.


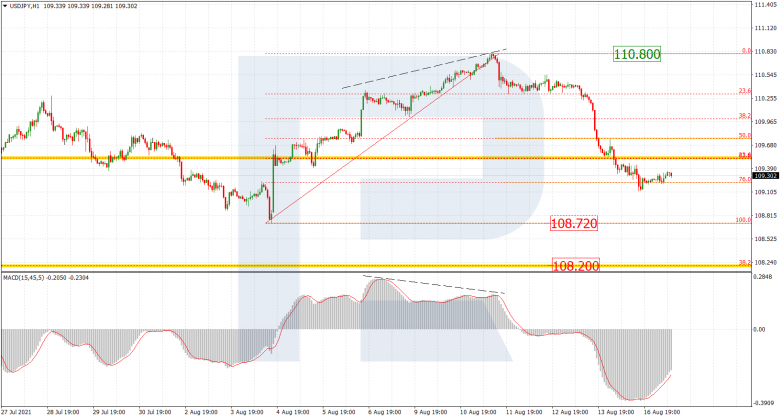
The H1 chart shows a more detailed structure of the new descending wave, which has already tested 76.0% fibo and may later continue to break the low at 108.72 and reach 38.2% fibo at 108.20. The local resistance is at 110.80.


