XAUUSD, “Gold vs US Dollar”
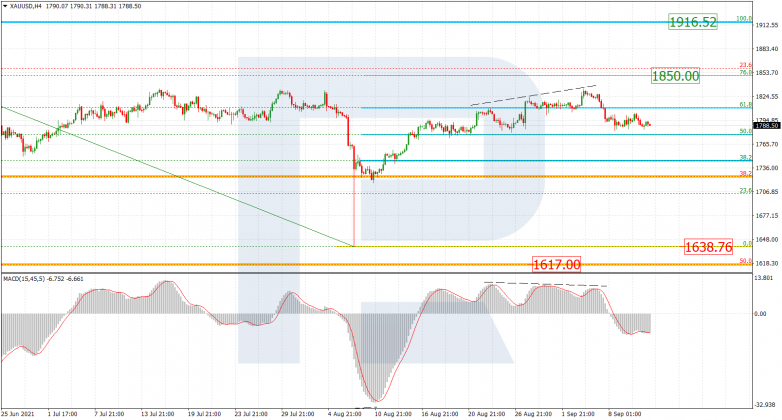
In the H4 chart, after breaking 61.8% fibo and failing to reach 76.0% fibo at 1850.00, the asset has started falling due to divergence on MACD. This movement may be the start of a new mid-term descending wave towards the low at 1638.76, a breakout of which may lead to a further downtrend to reach 50.0% fibo at 1617.00.


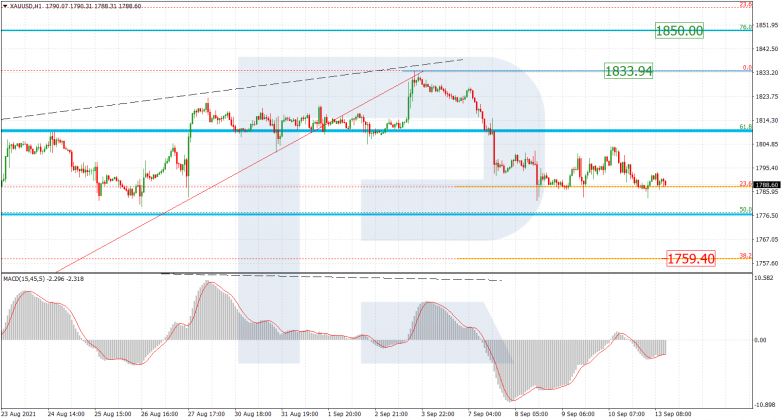
As we can see in the H1 chart, the first descending wave is testing 23.6% fibo. The next downside target is 38.2% fibo at 1759.40. At the same time, a breakout of the current high at 1833.94 will result in a further rising tendency.


USDCHF, “US Dollar vs Swiss Franc”
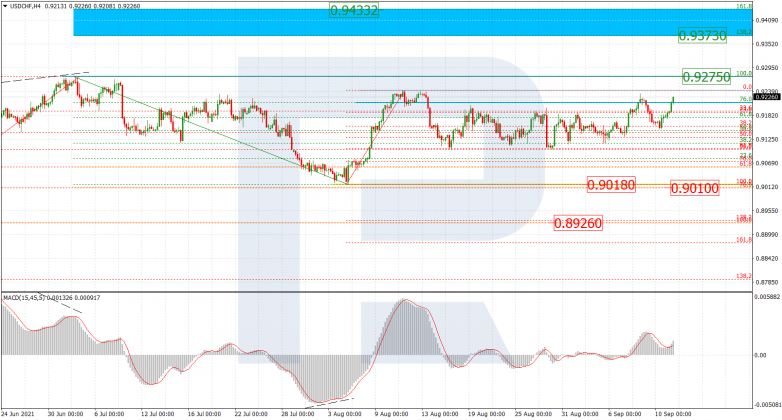
In the H4 chart, USDCHF continues forming the rising impulse to reach the high at 0.9275, a breakout of which will lead to a further uptrend towards the post-correctional extension area between 138.2% and 161.8% fibo at 0.9373 and 0.9433 respectively. on the other hand, the asset may rebound from the high and start a new decline towards the fractal support at 0.9018.


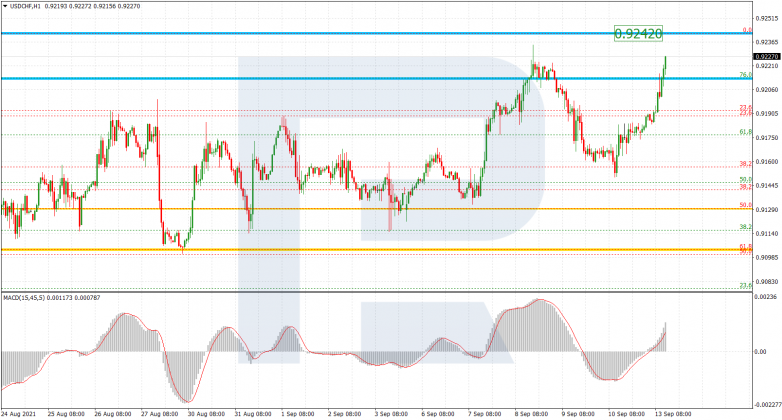
The H1 chart shows that the pair is approaching the local resistance at 0.9242.


