Brent
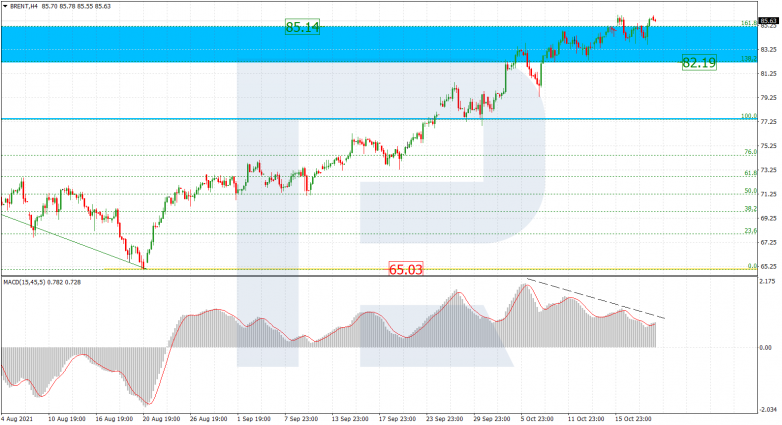
As we can see in the H4 chart, after breaking the post-correctional extension area between 138.2% and 161.8% fibo at 82.19 and 85.14 respectively, Brent continues growing steadily to reach the fractal high at 87.09. At the same time, there is divergence on MACD, which may indicate a possible pullback to the downside. The key support here remains the local low at 65.03.


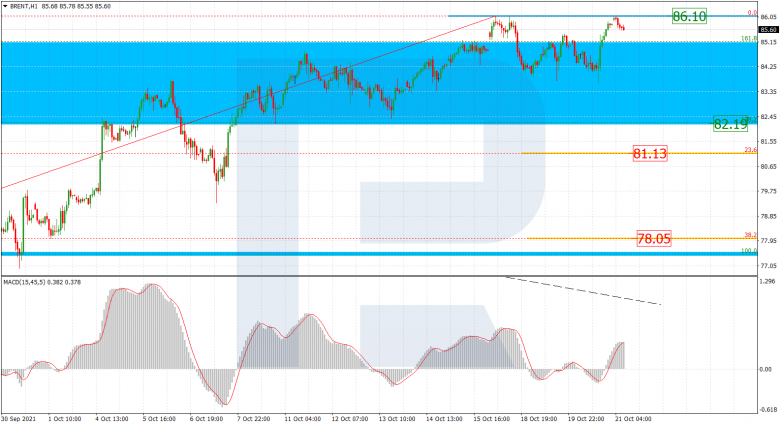
The H1 chart shows the potential short-term downside correctional targets after divergence on MACD and a test of 86.10. If the pair fails to break the high in the nearest future, the asset may fall towards 23.6% and 38.2% fibo at 81.13 and 78.05 respectively.


Dow Jones
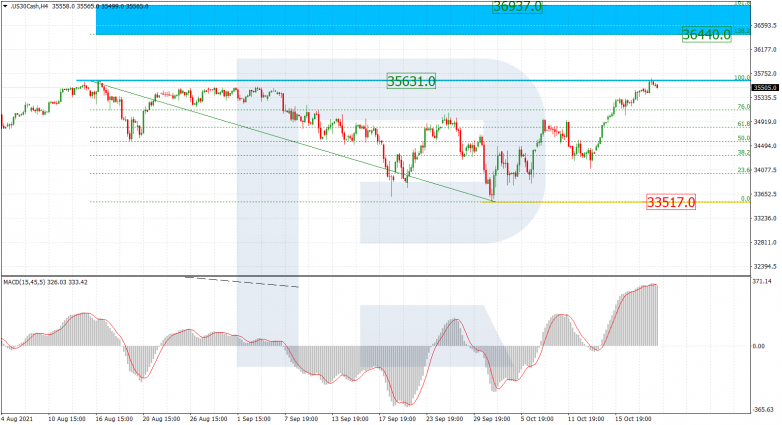
As we can see in the H4 chart, the asset continues trading upwards; right now, it is testing the high at 35631.0, a breakout of the which will lead to a further uptrend towards the post-correctional extension area between 138.2% and 161.8% fibo at 36440.0 and 36937.0 respectively. The key support is the fractal low at 33517.0.


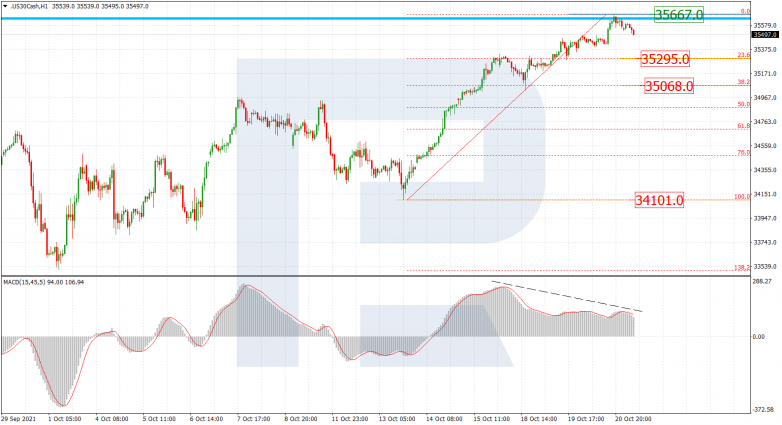
The H1 chart shows divergence on MACD, which indicates a possible pullback to the downside after the price finishes the ascending wave. The correctional targets may be 23.6% and 38.2% fibo at 35295.0 and 35068.0 respectively. After the pullback is over, the asset may resume trading upwards. The local support is at 34101.0.


