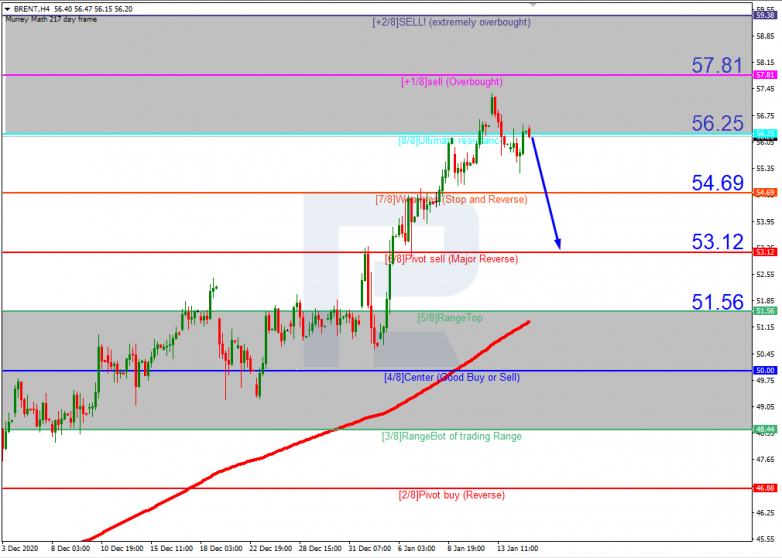
As we can see in the H4 chart, Brent has reached the “overbought area”. In this case, the asset is expected to break 8/8 and then correct downwards to reach the support at 6/8. However, this scenario may no longer be valid if the price breaks 1/8 to the upside. After that, the instrument may continue growing towards the resistance at 2/8.

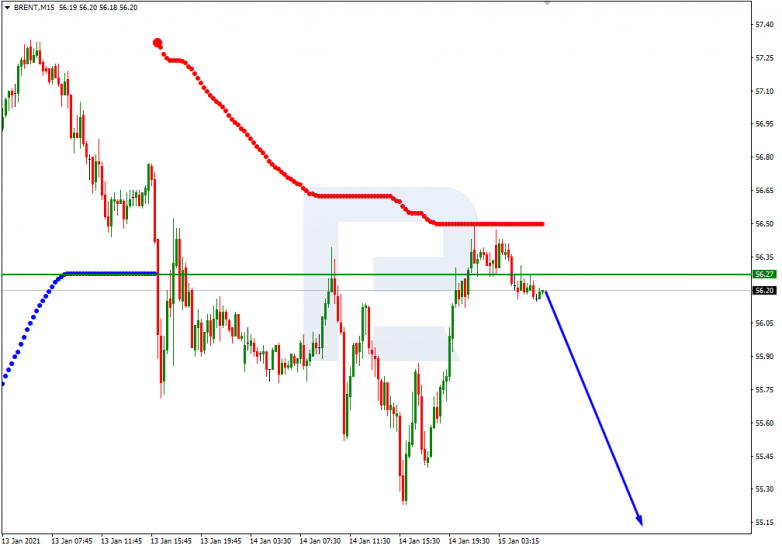
In the M15 chart, the price has broken the downside line of the VoltyChannel indicator again and, as a result, continue the descending tendency.

S&P 500
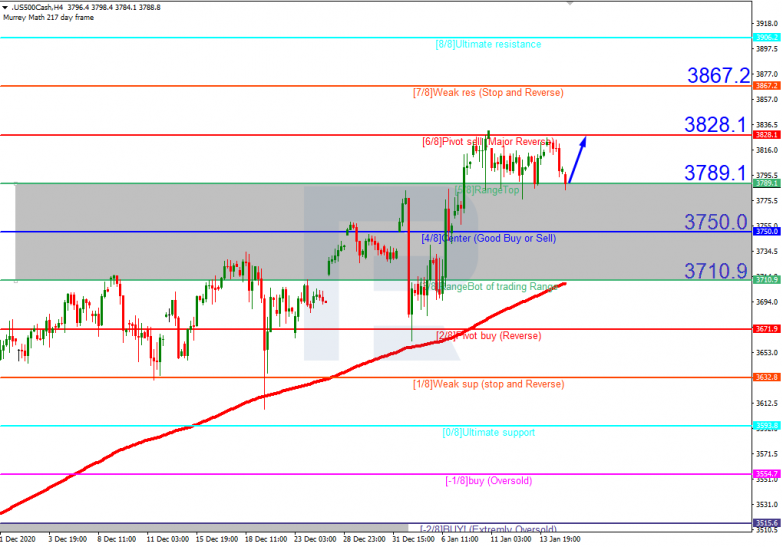
As we can see in the H4, the S&P Index is moving above the 200-day Moving Average, thus indicating an ascending tendency. In this case, the asset is expected to rebound from 5/8 and then c resume growing towards its all-time highs at 6/8. However, this scenario may no longer be valid if the price breaks 5/8 to the downside. After that, the instrument may correct to reach the support at 4/8.

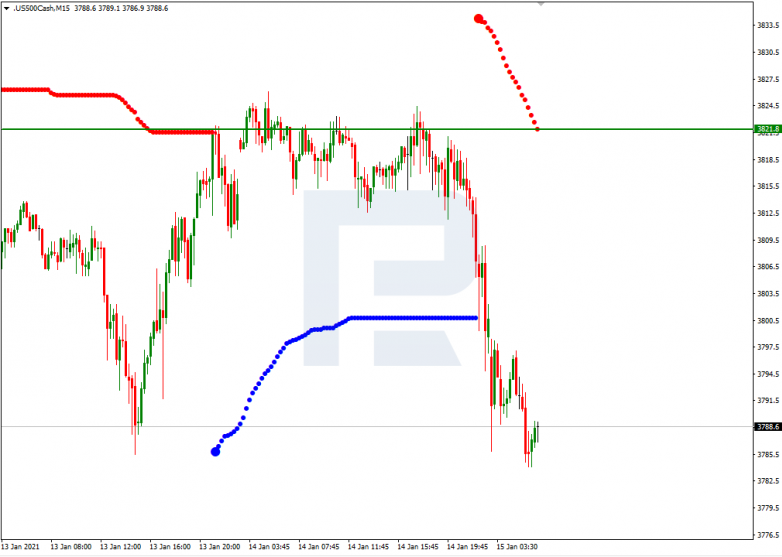
In the M15 chart, the price is quite far away from the upside line of the VoltyChannel indicator, that’s why it may resume growing only after rebounding from the 5/8 from the H4 chart.