Forex Murrey Math Lines and Forecasts


Murrey Math Lines 24.03.2023 (Brent, S&P 500)
BrentOn H4, Brent quotes are under the 200-day Moving Average, revealing the prevalence of a downtrend. The RSI has broken the support line. In such circumstances, we should expect 0...
Murrey Math lines 23.03.2023 (USDCHF, XAUUSD)
USDCHF, “US Dollar vs Swiss Franc” On H4, the quotes are under the 200-day Moving Average, which indicates the prevalence of a downtrend. The RSI pushed off the resistanc...
Murrey Math Lines 22.03.2023 (USDJPY, USDCAD)
22.03.2023USDJPY, “US Dollar vs Japanese Yen”On H4, the quotes are under the 200-day Moving Average, revealing the prevalence of a downtrend. The RSI is nearing the resistance line. ...
Murrey Math Lines 21.03.2023 (AUDUSD, NZDUSD)
21.03.2023AUDUSD, “Australian Dollar vs US Dollar”On H4, the quotes are under the 200-day Moving Average, which reveals the prevalence of a downtrend. The RSI has broken the support ...
Murrey Math Lines 20.03.2023 (EURUSD, GBPUSD)
20.03.2023EURUSD, “Euro vs US Dollar”On H4, the quotes are in the overbought area. The RSI has pushed off the support line. Currently, the 0/8 (1.0742) level is likely to break, and ...
Murrey Math Lines 17.03.2023 (Brent, S&P 500)
17.03.2023BrentOn H4, Brent is in the oversold area. The RSI is testing the resistance line. In this situation we should expect a break-up of the level 0/8 (75.00) and rise to the re...
Murrey Math Lines 16.03.2023 (USDCHF, XAUUSD)
16.03.2023USDCHF, “US Dollar vs Swiss Franc”On H4, USDCHF pair has broken through the 200-day Moving Average and is now above it, which indicates a possible bullish trend. The RSI is...
Murrey Math Lines 15.03.2023 (USDJPY, USDCAD)
15.03.2023USDJPY, “US Dollar vs Japanese Yen”On H4, USDJPY is above the 200-day Moving Average, which indicates that an upward trend is prevailing. The RSI has broken the resistance ...
Murrey Math Lines 14.03.2023 (AUDUSD, NZDUSD)
14.03.2023AUDUSD, “Australian Dollar vs US Dollar”On H4, the AUDUSD is below the 200-day Moving Average, indicating a prevailing downtrend. The RSI is testing the resistance line. In...
Murrey Math Lines 13.03.2023 (EURUSD, GBPUSD)
13.03.2023EURUSD, “Euro vs US Dollar”On H4, the EURUSD has broken through the 200-day Moving Average and is now above it, indicating that an uptrend is possible. The RSI has reached ...

About Murrey Math Lines

Being rather a new trading indicator, Murrey math lines become more prominent with each day.  Not only can it show supports and resistances, but also helps in determining the trends and trend changes. Using the respective indicator is quite simple, due to its resemblance to pivot points and Fibonacci retracements. Murrey math lines and forecasts were developed based on the research performed by William Gann, and therefore, represent an easy way to realize Gann.


Using the Murrey Math Lines

Murrey math lines and forecasts come in pretty handy when striving for the 100% fulfilled Technical Analysis. The great contribution of T. H. Murrey was the development of a system of geometry that can be used to follow market price movements in time.

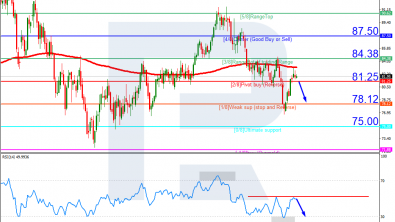
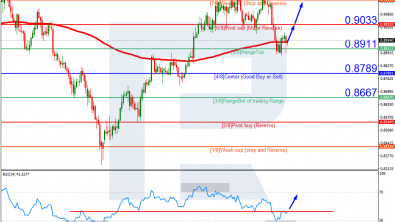
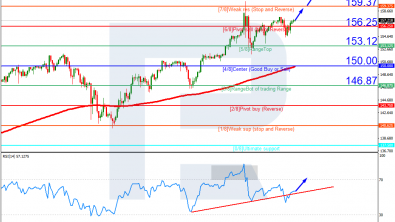
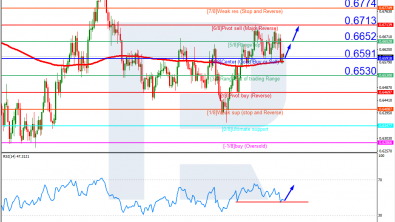
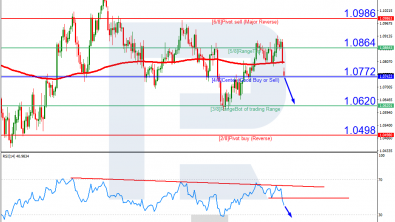
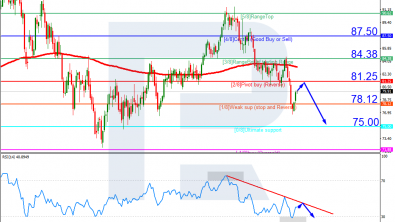
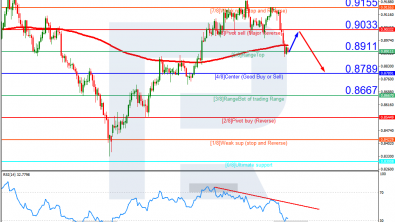
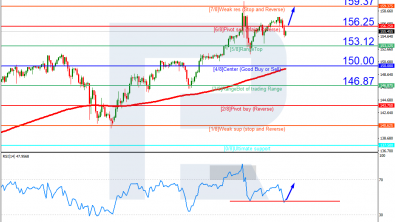
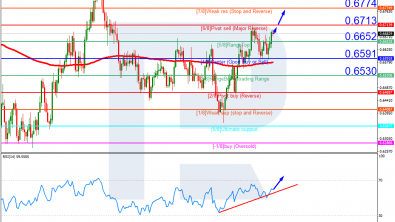
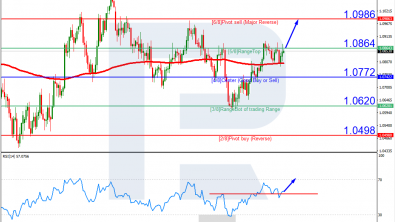
The indicator includes 9 lines that move parallel to one another. The first line from the bottom (0/8 - oversold) and the last one (8/8 - overbought) are the hardest lines to cross, and when it happens, the chances of the price reversal are pretty high. The normal trading range is considered to be between the lines 3/8 and 5/8. These lines are actually crucial in determining the state of the trading market. If the price stays near the line 5/8 for more than 8-9 days, it is advisable to sell in this zone. When the price is running down below the line 3/8, it will most likely continue falling to the next resistance level.

When the price appears between two lines, the upper one is regarded as resistance and the lower one - as support.

What Should the Trader Be Cautious Of?

Murrey Math lines are basically a set of support and resistance lines and like any such line are unpredictive. This means that while trading with the help of these lines, there's always a risk of price not moving in the direction suggested by Murrey. Therefore, the trading strategy that is based on Murrey math lines better have a good risk management to avoid losing capital.

By visiting our website and services, you agree to the conditions of use of cookies. Learn more
I agree