Forex Wave Analysis and Forecast








Be aware of price movement using wave analysis
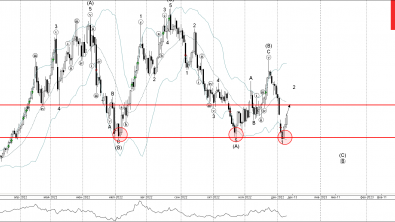
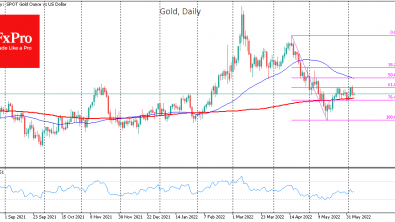
The goal of the Elliott wave analysis is to use the price move’s laws during its work, as for the market movement is characteristic a wave-like nature. The main instrument of Forex wave analysis is the price itself (the graph). The charts, where the price moves occur, are marked by analysts on the main waves and the sub-waves, respectively. The forecasts regarding the forthcoming price moves are formed grounding on the above mentioned marks.
Determination of Preliminary Variations of Price Movement, as the Essence of Forex Wave Analysis
The main postulates of the Elliott wave analysis state that for the price move on any market is characteristic the wave motion, which allows to forecast the further development of situation. The Forex wave analysis provided to you by the best Forex brokers enables to figure out the preliminary variations of the price move continuation, the approximate and the minimum potential of the given options, and knowing the criteria of their approval, use any of them for profit earning, realizing which one is taken for the profit earning, in order to keep the chosen wave till the end of transaction. It should identify the impulse waves and the corrective ones, as the price movement is divided into two main groups of waves:
- Impulses - that move the wave’s price either upward, or downward (marked by numerals)
- Corrections – the waves, used in order to react on the impulse sufficiently (marked by letters)
The Identification of Wave and Procedure of it's Plotting on the Price Chart
The market wave analysis marks out several methods in order to identify the wave, when plotting it on the chart: on the closing prices, on the maximum prices and on the minimum ones, or based on the average. For a novice trader, who just started to use the Elliott wave technical analysis, the best way for the waves plotting on the chart is the coupling together the maximum price with the minimum one, and minimum price with the maximum one, respectively. In this case the wave marking becomes visual, and the novice trader quickly “gets one’s hand “.
To reduce the risk of loss when using the Forex wave theory and for the proper calculation of stop loss size, special attention should be paid to the length of waves. Experts of the market wave analysis indicate that the longer the impulse waves are, the longer the corrective ones will be, respectively.
