AUDUSD, “Australian Dollar vs US Dollar”
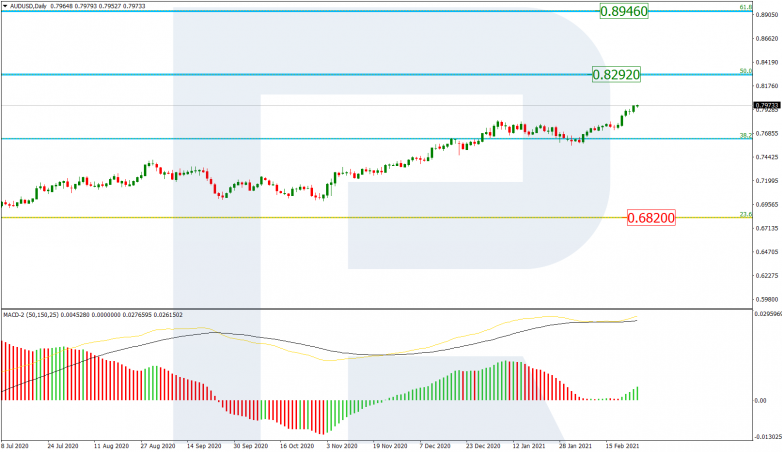
As we can see in the daily chart, the asset is forming another rising wave within the uptrend. After consolidating and correcting around 38.2% fibo, AUDUSD is heading towards 50.0% fibo at 0.8292. After reaching this level, the price may probably start a new correction, which is confirmed by a divergence on MACD. After the pullback is over, the instrument may form a new rising impulse towards 61.8% fibo at 0.8946. The key support is 23.6% fibo at 0.6820.


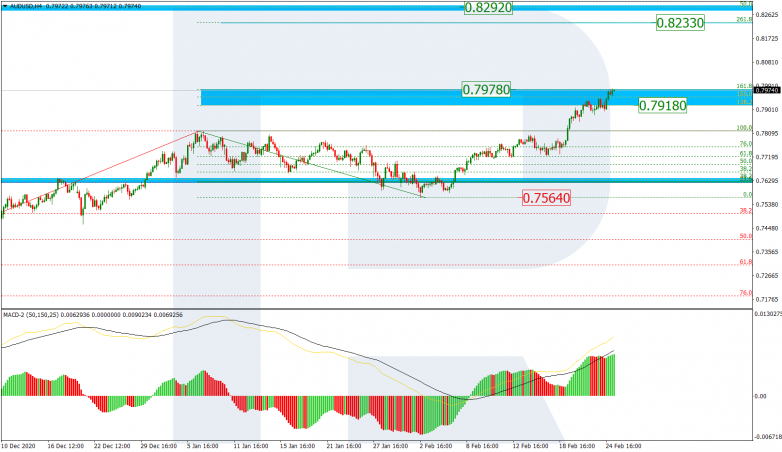
The H4 chart shows that after breaking the previous high, the price is moving inside the post-correctional extension area between 138.2% and 161.8% fibo at 0.7918 and 0.7978 respectively. After breaking it, the pair may continue rising to reach 261.8% fibo at 0.8233. The support is the low at 0.7564.


USDCAD, “US Dollar vs Canadian Dollar”
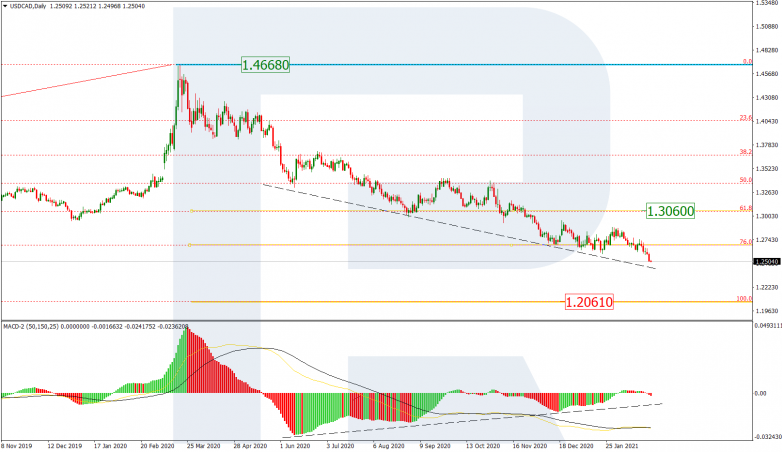
The daily chart shows a stable downtrend. After finishing consolidating at 76.0% fibo, USDCAD is heading towards the fractal low at 1.2061. At the same time, there is a divergence on MACD, which may hint at a possible correction. The resistance is 61.8% fibo at 1.3060.


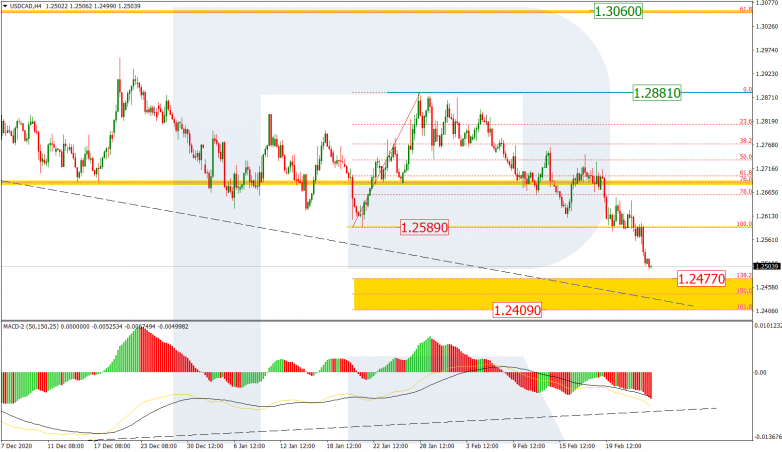
As we can see in the H4 chart, after completing the correctional uptrend, the pair is falling and has already broken the low at 1.2589. At the moment, the price is heading towards the post-correctional extension area between 138.2% and 161.8% fibo at 1.2477 and 1.2409 respectively. The local resistance is the high at 1.2881.


