The minutes from the Fed’s last meeting assured investors that interest rates will be kept low until 2023, which led to a weakening of the dollar and a decline in UST yields to 1.614%.
Today’s macro agenda (GMT 3)
- 15:00 UK: BoE quarterly bulletin
- 15:30 Canada: employment rate and employment changes (March); US: PPI (March)
- 20:00 US: Baker Hughes weekly rig count
Current outlook
All main currencies have entered negative territory in Asian trading. The steepest losses are seen in the New Zealand dollar (-0.55%) and the Australian dollar (-0.78%). The flight from risk-sensitive assets triggered a sharp decline in the 10-year UST yield to 1.65% ( 2.52%). Right now, market sentiment is hovering in wait-and-see mode ahead of the weekend.
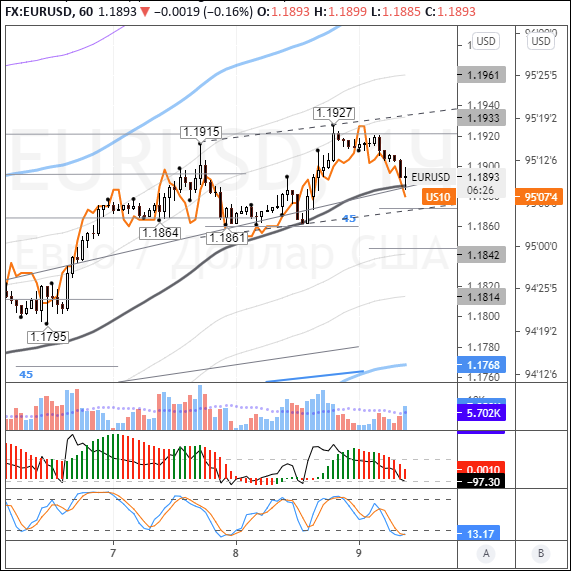
Meanwhile, EURUSD faces profit-taking in long positions. The price action in the key pair fell to 1.1885 (-0.22%). Sellers met resistance at 1.1887 (the balance line), although given that buyers have started to sell the euro in crosses, the odds are high that the decline in the EURUSD pair will pick up to 1.1870 (the 45-degree angle).
The macro news flow underpinning the single currency is essentially a blank slate today. For this reason, the DXY dollar index will be driven by UST dynamics and euro crosses. On the hourly timeframe, the Stochastic Oscillator is in the buying territory. Buyers have a five-hour window to turn the situation around. The longer the price action remains at 1.1890, the more likely it will be to see it at 1.1845 on Friday (04/09) or Monday (04/12). The euro chart also contains a dot plot of the 10-year UST yield curve.