• Ford broke resistance level 9,50
• Likely to rise to 10,50
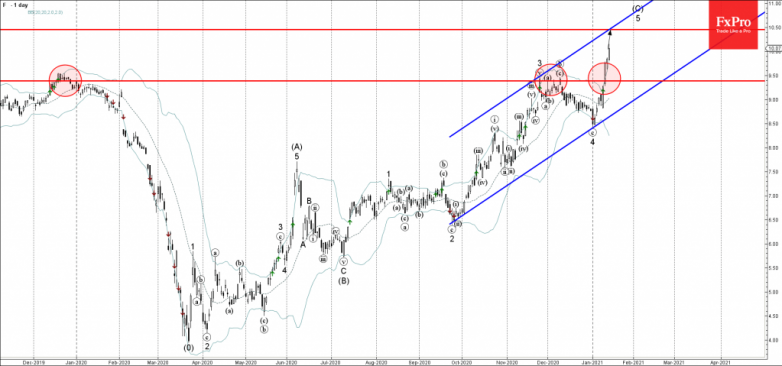
Ford recently broke sharply above the long-term resistance level 9,50 (which has been reversing the price from December of 2019 – as can be seen below).
The breakout of the resistance level 9,50 added to the bullish pressure on Ford – accelerating the active impulse sequences 5 and (C).
Given the clear daily uptrend – Ford is expected to rise further toward the next resistance level 10,50 (intersecting with the daily up channel from September).