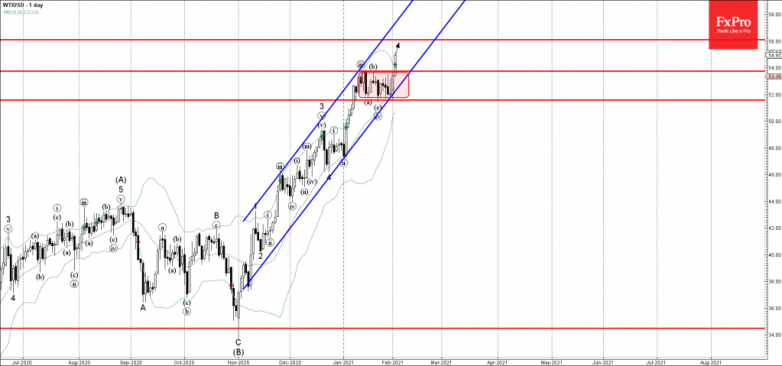
• WTI broke sideways price range
• Likely to test resistance level 56.00
WTI oil recently broke the minor resistance level 53.75 (which is the upper boundary of the tight sideways price range from the start of January).
The breakout of this price range accelerated the active short-term impulse wave (v) – which belongs to the sharp impulse wave 5 of the longer-term upward impulse sequence (C) from November.
Given the clear uptrend – WTI can be expected to rise further toward the next resistance level 56.00. Strong support now stands at the aforementioned price level 53.75.


