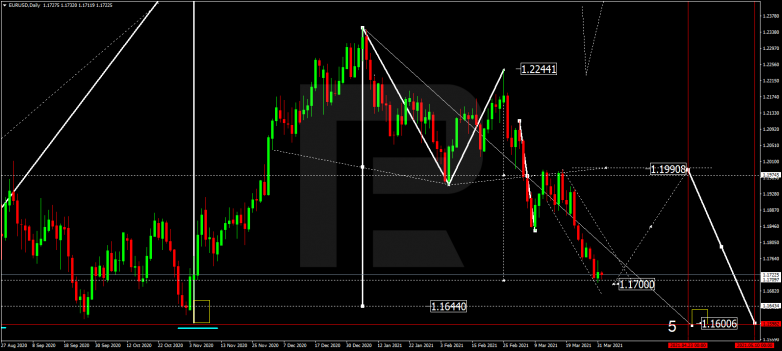
EURUSD, “Euro vs US Dollar”
As we can see in the daily chart, after failing to break 1.1990 to continue the ascending wave towards 1.2250, EURUSD rebounded from the former level and formed another descending wave to reach 1.1850. After that, the instrument formed a downside continuation pattern, broke 1.1850 downwards, and completed the descending wave at 1.1707, thus finishing a five-wave structure that may be considered as the third descending correctional wave. Right now, the asset is consolidating near the lows. Possibly, the pair may break the range to the upside and start a new growth to reach 1.1990 (at least). Later, the market may form the fifth descending wave with the target at 1.1644 or even reach 1.1600.

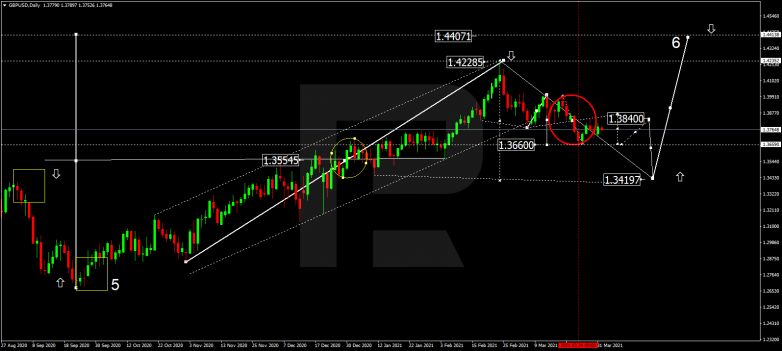
GBPUSD, “Great Britain Pound vs US Dollar”
In the daily chart, after breaking 1.3840, GBPUSD is expected to form a new descending wave with the short-term target at 1.3660; right now, it is growing to test 1.3840 from below and may later fall towards the above-mentioned target. After that, the instrument may form one more ascending structure to return to 1.3840 and then start a new decline to reach 1.3420 to complete this descending wave. Later, the market may resume moving upwards with the target at 1.4410.

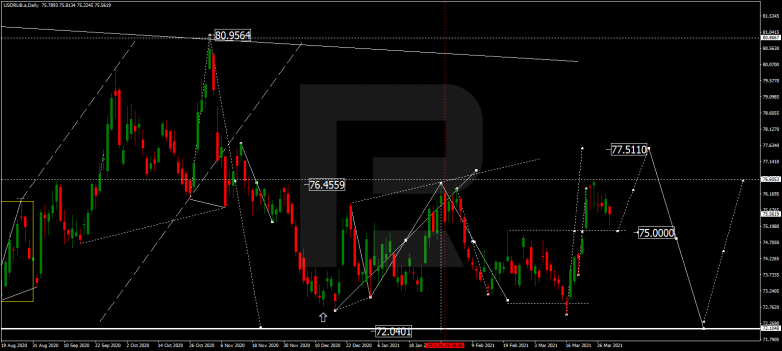
USDRUB, “US Dollar vs Russian Ruble”
As we can see in the daily chart, after finishing the descending wave at 73.23, USDRUB is forming a wide consolidation range above this level. After breaking 75.00 to the upside, the asset may continue trading upwards to reach 77.50. By now, the pair has reached the short-term target at 76.00. Possibly, the price may correct to test 75.00 from above and then resume growing towards 77.50. After that, the instrument may start a new decline with the target at 72.04.

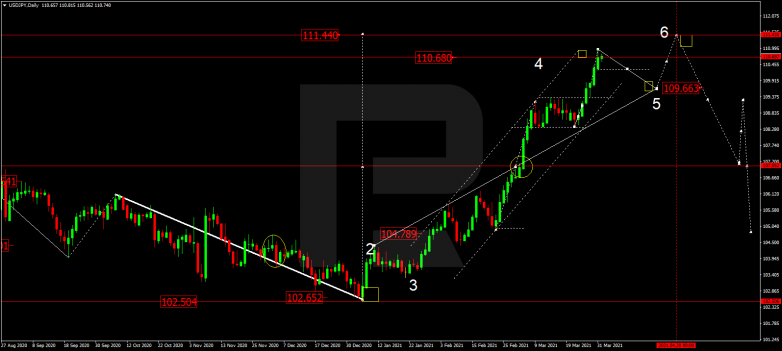
USDJPY, “US Dollar vs Japanese Yen”
In the daily chart, after forming an upside continuation pattern at 108.00 and completing another ascending wave towards 110.70, USDJPY is expected to consolidate near the highs. After breaking this range to the downside, the instrument may start a new correction to reach 109.66 (at least). Later, the market may form one more ascending wave with the target at 111.44.

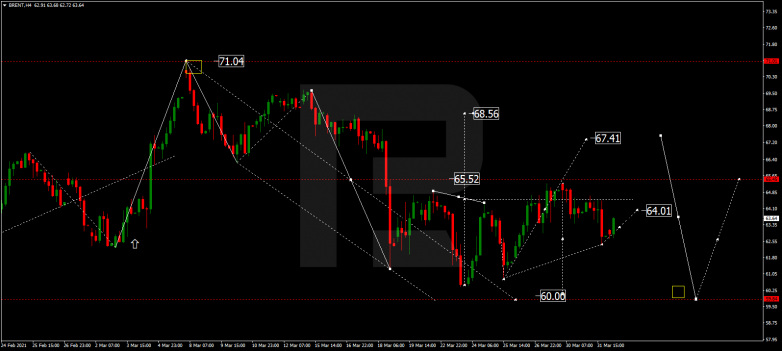
BRENT
As we can see in the H4 chart, Brent is forming a wide consolidation range around 64.00. If later the price breaks this range to the downside, the market may continue the correction towards 60.00; if to the upside – resume trading upwards to reach 68.55. the main scenario implies that after that the instrument may continue trading within the downtrend with the key target at 60.00.

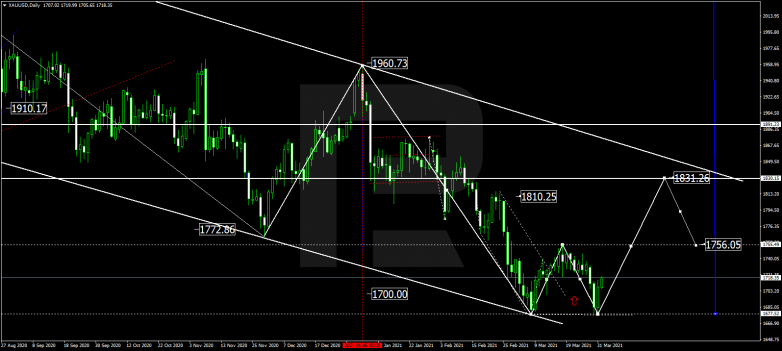
XAUUSD, “Gold vs US Dollar”
In the daily chart, Gold has completed another descending structure at 1680.40; in fact, it has almost formed a Double Bottom pattern. Possibly, the metal may start a new growth towards 1765.00. If the price breaks this range to the upside, the market may form one more ascending wave with the first target at 1813.25. However, if the pair falls and breaks 1680.40, it may continue falling to reach 1660.00. After that, the instrument may resume moving upwards with the target at 1756.00.

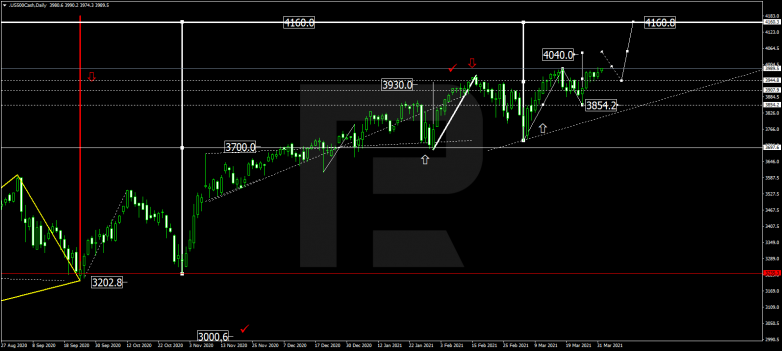
S&P 500
In the daily chart, after rebounding from 3854.2, the S&P index continues trading upwards. Possibly, the asset may reach the first target at 4040.0 and then start a new correction towards 3945.0. After that, the instrument may resume trading upwards with the key target at 4160.00.